Alzheimer’s Disease Report
Marta Kowalczyk
1. Introduction
Alzheimer’s disease is one of the most common neurodegenerative diseases, affecting millions of individuals worldwide. As a progressive condition, it leads to the decline of cognitive functions such as memory, reasoning, and the ability to perform everyday tasks. Understanding the risk factors for Alzheimer’s disease is crucial, as early detection and prevention strategies can slow the progression of symptoms and improve the quality of life for patients and their families.
The objective of this project is to identify key risk factors and lifestyle variables that may influence the development and diagnosis of Alzheimer’s disease, and to analyse the relationships between various variables and the progression of the disease.
Research questions:
- Which demographic factors have a significant impact on the diagnosis of Alzheimer’s disease?
- Which lifestyle habits (smoking, alcohol use, diet, physical activity) are associated with a higher or lower risk of developing Alzheimer’s disease?
- Are individuals with a family history of Alzheimer’s more likely to develop the disease than those without a family history?
- Do individuals with comorbid conditions have a higher risk of Alzheimer’s compared to those without these conditions?
- Which clinical measurements and their results increase the risk of Alzheimer’s?
The exploratory data analysis (EDA) and statistical tests will be performed using Python, while data visualization will be carried out in Power BI for clear and insightful presentation.
2. Data Description
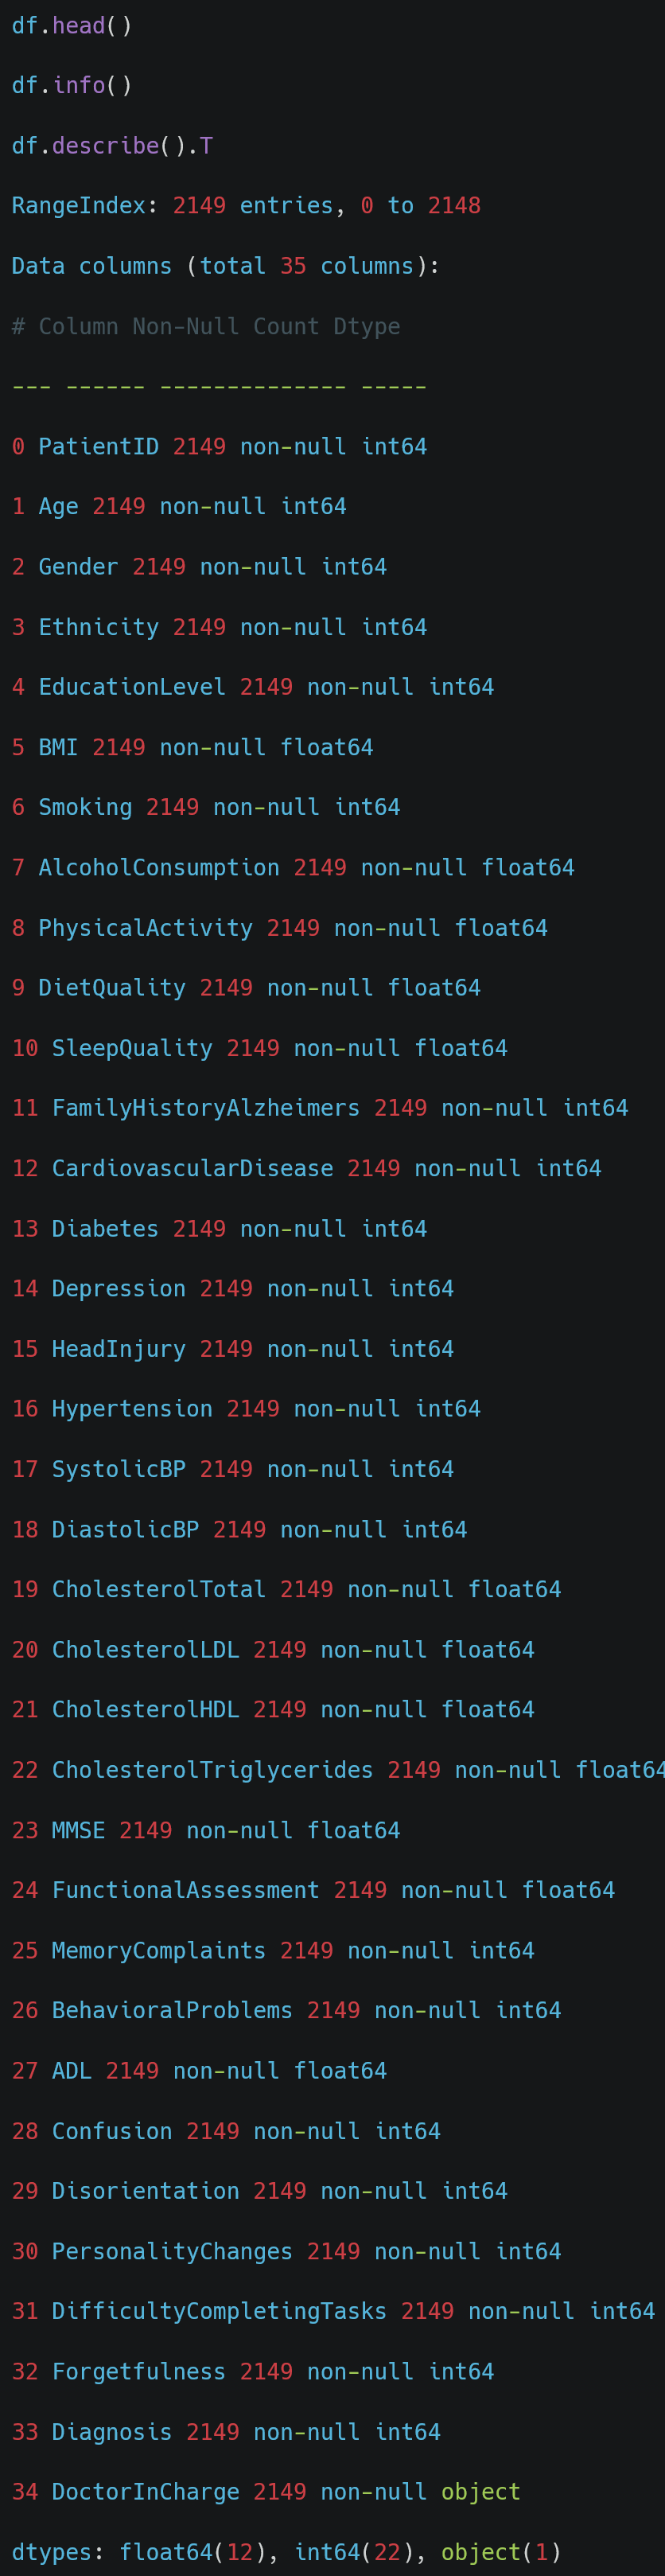
This set was found on Kaggle page (https://www.kaggle.com/datasets/rabieelkharoua/alzheimers-disease-dataset). It was chosen as it offers comprehensive health and lifestyle information for Alzheimer’s patients. It contains health information for 2,149 patients.
- PatientID: A unique identifier assigned to each patient (4751 to 6900). It will be removed from the analysis.
- Age: The age of the patients ranges from 60 to 90 years.
- Gender: Gender of the patients, where 0 represents Male and 1 represents Female. Categorical variable.
- Ethnicity: The ethnicity of the patients. Categorical variable. Coded as follows:
- 0: Caucasian
- 1: African American
- 2: Asian
- 3: Other
- EducationLevel: The education level of the patients. Categorical variable. Coded as follows:
- 0: None
- 1: High School
- 2: Bachelor’s
- 3: Higher
- BMI: Body Mass Index of the patients, ranging from 15 to 40.
- Smoking: Smoking status, where 0 indicates No and 1 indicates Yes. Categorical variable.
- AlcoholConsumption: Weekly alcohol consumption in units, ranging from 0 to 20.
- PhysicalActivity: Weekly physical activity in hours, ranging from 0 to 10.
- DietQuality: Diet quality score, ranging from 0 to 10.
- SleepQuality: Sleep quality score, ranging from 4 to 10.
- FamilyHistoryAlzheimers: Family history of Alzheimer’s Disease, where 0 indicates No and 1 indicates Yes. Categorical variable.
- CardiovascularDisease: Presence of cardiovascular disease, where 0 indicates No and 1 indicates Yes. Categorical variable.
- Diabetes: Presence of diabetes, where 0 indicates No and 1 indicates Yes. Categorical variable.
- Depression: Presence of depression, where 0 indicates No and 1 indicates Yes. Categorical variable.
- HeadInjury: History of head injury, where 0 indicates No and 1 indicates Yes. Categorical variable.
- Hypertension: Presence of hypertension, where 0 indicates No and 1 indicates Yes. Categorical variable.
- SystolicBP: Systolic blood pressure, ranging from 90 to 180 mmHg.
- DiastolicBP: Diastolic blood pressure, ranging from 60 to 120 mmHg.
- CholesterolTotal: Total cholesterol levels, ranging from 150 to 300 mg/dL.
- CholesterolLDL: Low-density lipoprotein cholesterol levels, ranging from 50 to 200 mg/dL.
- CholesterolHDL: High-density lipoprotein cholesterol levels, ranging from 20 to 100 mg/dL.
- CholesterolTriglycerides: Triglycerides levels, ranging from 50 to 400 mg/dL.
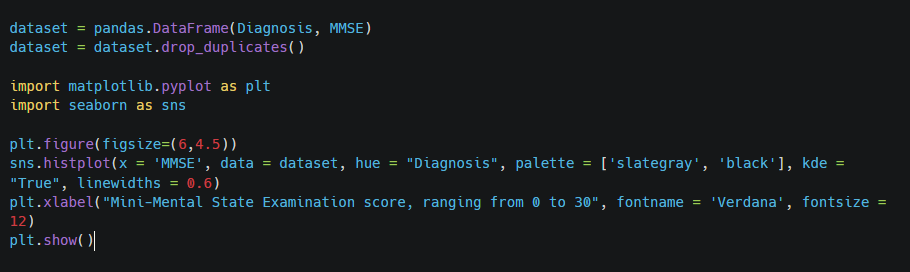
- MMSE: Mini-Mental State Examination score, ranging from 0 to 30. Lower scores indicate cognitive impairment.
- FunctionalAssessment: Functional assessment score, ranging from 0 to 10. Lower scores indicate greater impairment.
- MemoryComplaints: Presence of memory complaints, where 0 indicates No and 1 indicates Yes. Categorical variable.
- BehavioralProblems: Presence of behavioural problems, where 0 indicates No and 1 indicates Yes. Categorical variable.
- ADL: Activities of Daily Living score, ranging from 0 to 10. Lower scores indicate greater impairment.
- Confusion: Presence of confusion, where 0 indicates No and 1 indicates Yes. Categorical variable.
- Disorientation: Presence of disorientation, where 0 indicates No and 1 indicates Yes. Categorical variable.
- PersonalityChanges: Presence of personality changes, where 0 indicates No and 1 indicates Yes. Categorical variable.
- DifficultyCompletingTasks: Presence of difficulty completing tasks, where 0 indicates No and 1 indicates Yes. Categorical variable.
- Forgetfulness: Presence of forgetfulness, where 0 indicates No and 1 indicates Yes. Categorical variable.
- Diagnosis: Diagnosis status for Alzheimer’s Disease, where 0 indicates No and 1 indicates Yes. Categorical variable.
- DoctorInCharge: This column contains confidential information about the doctor in charge, with «XXXConfid» as the value for all patients. It will be removed from the analysis.
3. Data Preprocessing
Import of Libraries

Import of the Data
Preliminary Data Exploration
| count | mean | std | min | 25% | 50% | 75% | max | |
|---|---|---|---|---|---|---|---|---|
| PatientID | 2149 | 5825.0000 | 620.5072 | 4751.0000 | 5288.0000 | 5825.0000 | 6362.0000 | 6899.0000 |
| Age | 2149 | 74.9088 | 8.9902 | 60.0000 | 67.0000 | 75.0000 | 83.0000 | 90.0000 |
| Gender | 2149 | 0.5063 | 0.5001 | 0.0000 | 0.0000 | 1.0000 | 1.0000 | 1.0000 |
| Ethnicity | 2149 | 0.6975 | 0.9961 | 0.0000 | 0.0000 | 0.0000 | 1.0000 | 3.0000 |
| EducationLevel | 2149 | 1.2866 | 0.9045 | 0.0000 | 1.0000 | 1.0000 | 2.0000 | 3.0000 |
| BMI | 2149 | 27.6557 | 7.2174 | 15.0089 | 21.6114 | 27.8239 | 33.8698 | 39.9928 |
| Smoking | 2149 | 0.2885 | 0.4532 | 0.0000 | 0.0000 | 0.0000 | 1.0000 | 1.0000 |
| AlcoholConsumption | 2149 | 10.0394 | 5.7579 | 0.0020 | 5.1398 | 9.9344 | 15.1579 | 19.9893 |
| PhysicalActivity | 2149 | 4.9202 | 2.8572 | 0.0036 | 2.5706 | 4.7664 | 7.4279 | 9.9874 |
| DietQuality | 2149 | 4.9931 | 2.9091 | 0.0094 | 2.4585 | 5.0761 | 7.5586 | 9.9983 |
| SleepQuality | 2149 | 7.0511 | 1.7636 | 4.0026 | 5.4830 | 7.1156 | 8.5625 | 9.9998 |
| FamilyHistoryAlzheimers | 2149 | 0.2522 | 0.4344 | 0.0000 | 0.0000 | 0.0000 | 1.0000 | 1.0000 |
| CardiovascularDisease | 2149 | 0.1443 | 0.3514 | 0.0000 | 0.0000 | 0.0000 | 0.0000 | 1.0000 |
| Diabetes | 2149 | 0.1508 | 0.3579 | 0.0000 | 0.0000 | 0.0000 | 0.0000 | 1.0000 |
| Depression | 2149 | 0.2006 | 0.4005 | 0.0000 | 0.0000 | 0.0000 | 0.0000 | 1.0000 |
| HeadInjury | 2149 | 0.0926 | 0.2899 | 0.0000 | 0.0000 | 0.0000 | 0.0000 | 1.0000 |
| Hypertension | 2149 | 0.1489 | 0.3561 | 0.0000 | 0.0000 | 0.0000 | 0.0000 | 1.0000 |
| SystolicBP | 2149 | 134.2648 | 25.9494 | 90.0000 | 112.0000 | 134.0000 | 157.0000 | 179.0000 |
| DiastolicBP | 2149 | 89.8478 | 17.5925 | 60.0000 | 74.0000 | 91.0000 | 105.0000 | 119.0000 |
| CholesterolTotal | 2149 | 225.1975 | 42.5422 | 150.0933 | 190.2530 | 225.0864 | 262.0317 | 299.9934 |
| CholesterolLDL | 2149 | 124.3359 | 43.3666 | 50.2307 | 87.1958 | 123.3426 | 161.7337 | 199.9657 |
| CholesterolHDL | 2149 | 59.4635 | 23.1392 | 20.0034 | 39.0957 | 59.7682 | 78.9390 | 99.9803 |
| CholesterolTriglycerides | 2149 | 228.2815 | 101.9867 | 50.4072 | 137.5832 | 230.3020 | 314.8390 | 399.9419 |
| MMSE | 2149 | 14.7551 | 8.6132 | 0.0053 | 7.1676 | 14.4417 | 22.1610 | 29.9914 |
| FunctionalAssessment | 2149 | 5.0801 | 2.8927 | 0.0005 | 2.5663 | 5.0944 | 7.5470 | 9.9965 |
| MemoryComplaints | 2149 | 0.2080 | 0.4060 | 0.0000 | 0.0000 | 0.0000 | 0.0000 | 1.0000 |
| BehavioralProblems | 2149 | 0.1568 | 0.3637 | 0.0000 | 0.0000 | 0.0000 | 0.0000 | 1.0000 |
| ADL | 2149 | 4.9830 | 2.9498 | 0.0013 | 2.3428 | 5.0390 | 7.5815 | 9.9997 |
| Confusion | 2149 | 0.2052 | 0.4040 | 0.0000 | 0.0000 | 0.0000 | 0.0000 | 1.0000 |
| Disorientation | 2149 | 0.1582 | 0.3650 | 0.0000 | 0.0000 | 0.0000 | 0.0000 | 1.0000 |
| PersonalityChanges | 2149 | 0.1508 | 0.3579 | 0.0000 | 0.0000 | 0.0000 | 0.0000 | 1.0000 |
| DifficultyCompletingTasks | 2149 | 0.1587 | 0.3655 | 0.0000 | 0.0000 | 0.0000 | 0.0000 | 1.0000 |
| Forgetfulness | 2149 | 0.3015 | 0.4590 | 0.0000 | 0.0000 | 0.0000 | 1.0000 | 1.0000 |
| Diagnosis | 2149 | 0.3537 | 0.4782 | 0.0000 | 0.0000 | 0.0000 | 1.0000 | 1.0000 |
Comment
The average age is about 75, aligning with the typical age for Alzheimer’s diagnosis. The wide range (30 years) suggests a diverse age group. There are no extreme outliers, but there is a notable concentration of patients in the older age brackets.
The dataset is almost evenly split between males and females, which allows for balanced gender-based analysis.
The mean BMI suggests a tendency towards overweight or obesity. The wide range indicates significant variability.
Around 25% of patients have a family history of Alzheimer’s, a significant risk factor.
Depression affects 20% of patients, which is significant and could interact with other risk factors for Alzheimer’s.
Handling Missing Values

Many columns have categorical data where 0 indicates No and 1 indicates Yes. I will replace the numerical values with text.

Dropping unnecessary Data

4. Exploratory Data Analysis – EDA
4.1 Which demographic factors have a significant impact on the diagnosis of Alzheimer’s disease?
Age
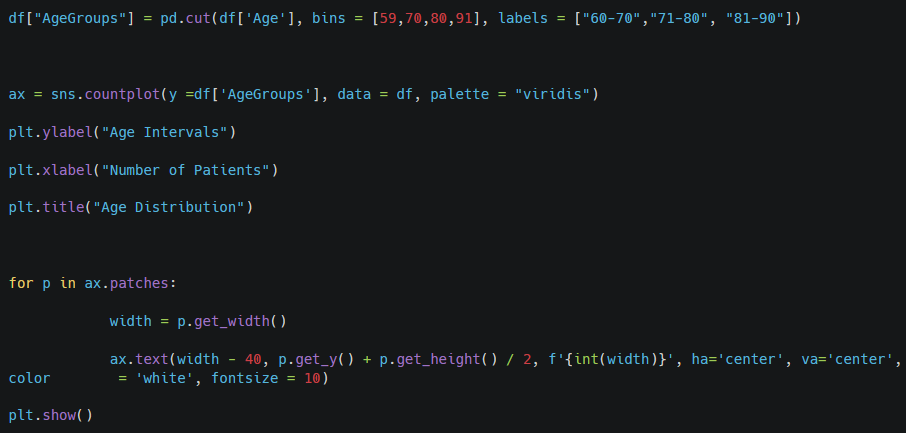
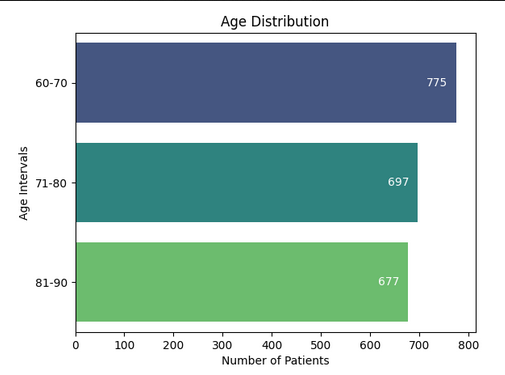
Comment: Most patients fall within the 71-80 age group, and this aligns with Alzheimer’s typically affecting older individuals.
Gender
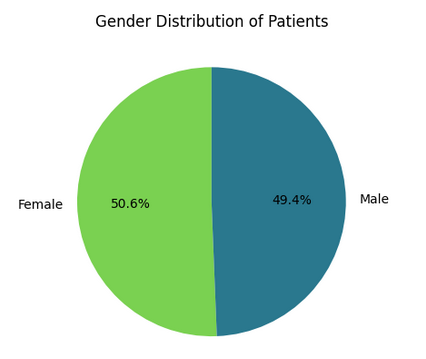
Comment: The dataset is almost evenly split between males and females.
Ethnicity
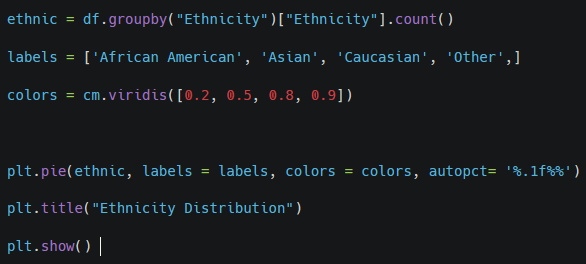
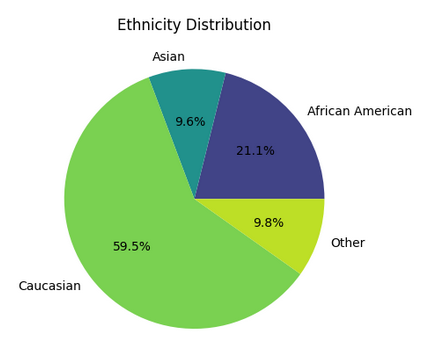
Comment: The most of the patients belong to Caucasian ethnicity. It reflects well the general population.
Education

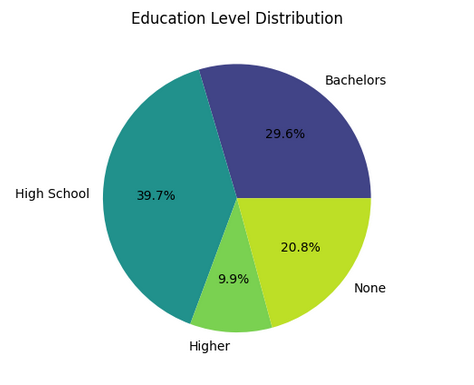
Comment: The «high school” group represents the largest segment of the population and may reflect a baseline level of educational achievement. A significant percentage of patients hold a bachelor’s degree and a smaller percentage of patients have pursued education beyond a bachelor’s degree. A notable segment of patients has no formal education. This lack of educational attainment could be associated with limited access to healthcare resources, which may impact the management and progression of Alzheimer’s disease.
Age, Gender, Ethnicity and Education Level vs Diagnosis

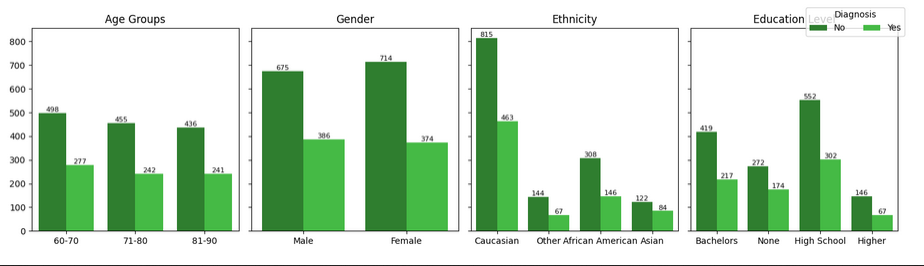
Comment:
* Age Groups: There is no obvious relation between older age and the diagnosis of Alzheimer’s. The number of diagnoses remains relatively stable across all age groups.
* Gender: The gender distribution shows that slightly more males have been diagnosed compared to females.
* Ethnicity: The representation of ethnicities shows some differences, but the percentage of Alzheimer’s diagnoses appears similar across all groups.
* Education level: The differences in the sizes of the educational level groups suggest that education level might influence the likelihood of being diagnosed.
Gender
Chi-square Test
Null Hypothesis: There is no association between gender and diagnosis.
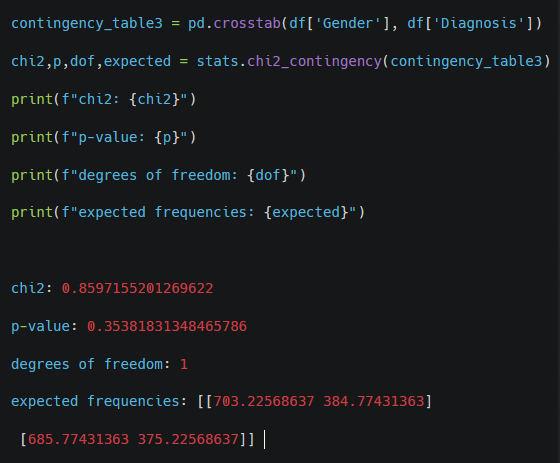
Comment: With a p-value of 0.354, which is greater than the common significance level (e.g., 0.05), we fail to reject the null hypothesis. This suggests that there is no statistically significant association between gender and Alzheimer’s diagnosis in this dataset.
Ethnicity
Chi-square Test
Null Hypothesis: There is no association between ethnicity and diagnosis.
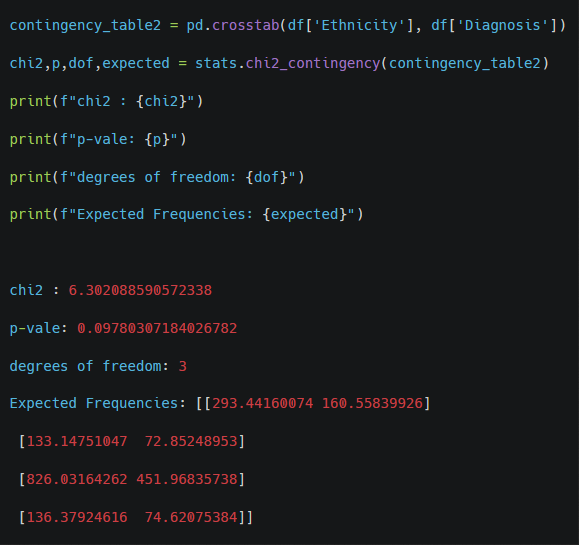
Comment: With a p-value of 0.098, which is higher than the standard significance level of 0.05 but relatively close, we fail to reject the null hypothesis. This suggests that there is no statistically significant association between ethnicity and Alzheimer’s diagnosis in this dataset.
Education Level
Chi-square Test
Null Hypothesis: There is no association between education level and diagnosis.
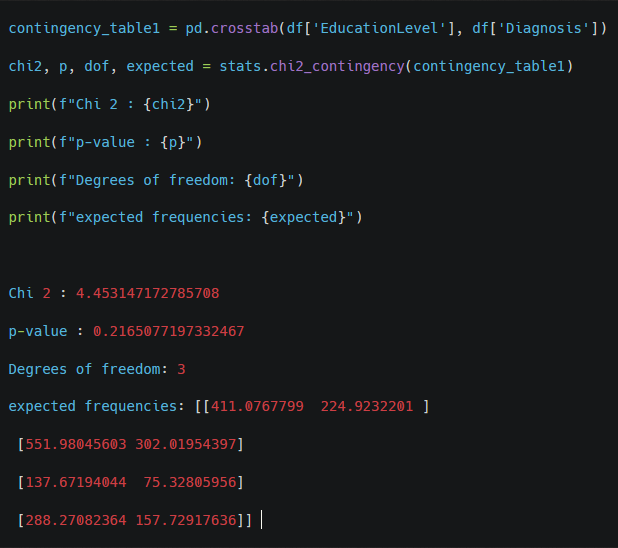
Comment: With a p-value of 0.217, which is higher than the significance threshold of 0.05, we fail to reject the null hypothesis. This suggests that there is no statistically significant association between education level and Alzheimer’s diagnosis in this dataset.
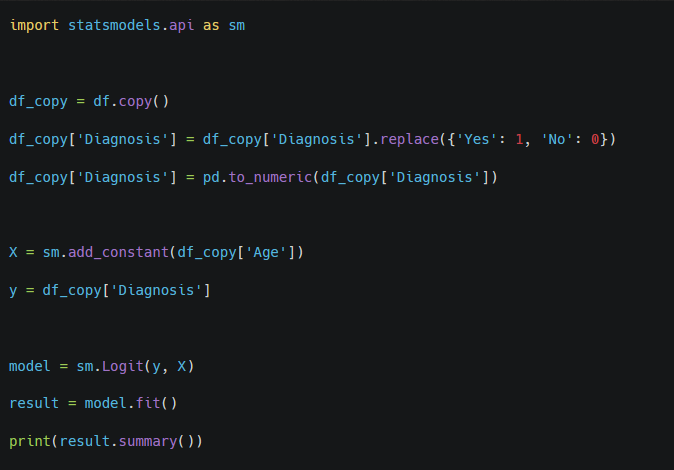
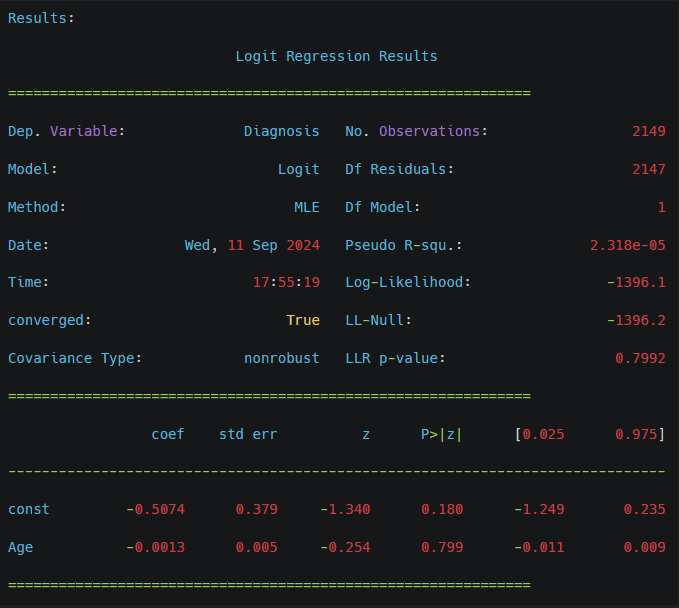
Logistic Regression
Categorical variable: Diagnosis
Predictors: Age groups
Null Hypothesis: There is no association between education level and diagnosis.
Comment: With a p-value of 0.217, which is higher than the significance threshold of 0.05, we fail to reject the null hypothesis. This suggests that there is no statistically significant association between education level and Alzheimer’s diagnosis in this dataset.
– Which demographic factors have a significant impact on the diagnosis of Alzheimer’s disease?
Chi-square Tests: No significant association found between ethnicity, gender, or education level and the diagnosis of Alzheimer’s.
Logistic Regression: Age does not significantly impact the diagnosis in this dataset.
Note: Age might have a non-linear relationship with the diagnosis, or the dataset may lack sufficient variation to detect such relationships.
4.2 Which lifestyle habits (smoking, alcohol use, diet, physical activity) are associated with a higher or lower risk of developing Alzheimer’s disease?
Smoking
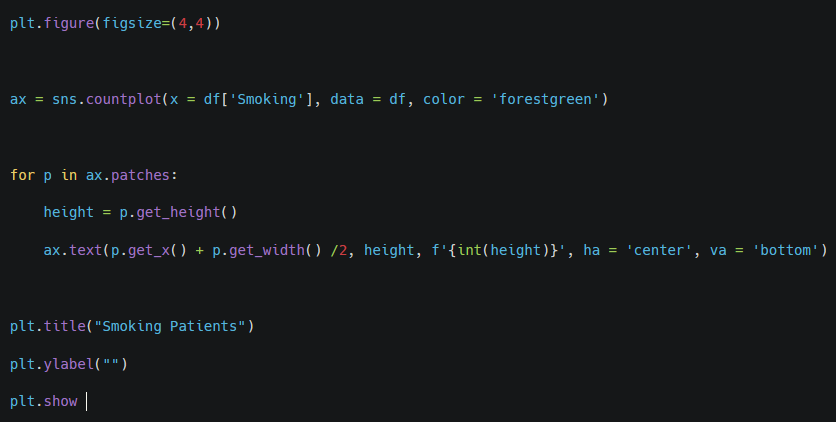
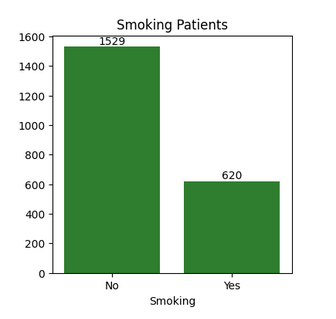
Comment: The bar chart illustrates the distribution of patients based on smoking status, with 1529 patients (around 71%) identified as non-smokers and 620 patients as smokers.
Alcohol Use

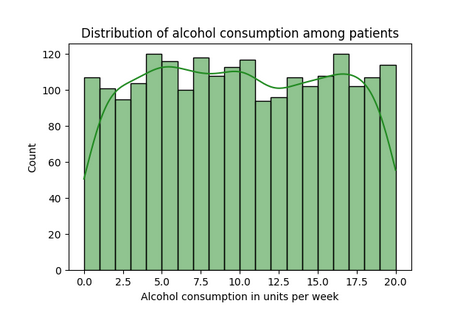
Comment: The histogram shows a relatively even distribution of alcohol consumption across the patients. There is no clear skew towards either low or high alcohol consumption, indicating that drinking habits among the patients are fairly balanced across all levels.
Diet
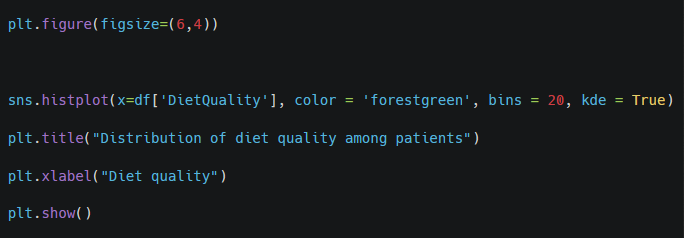
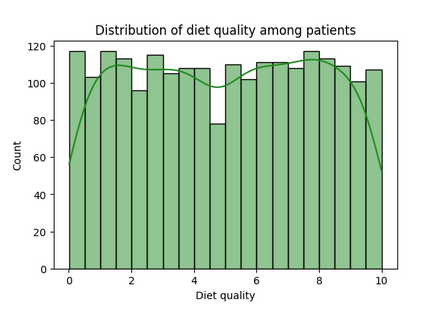
Comment: The histogram demonstrates that diet quality is fairly evenly distributed across the patient population, with diet quality scores spread out from 0 (lowest quality) to 10 (highest quality). This suggests there is a wide range of dietary habits among the patients.
Physical Activity

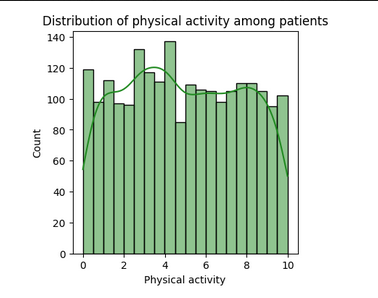
Comment: Most physical activity levels are represented by a similar number of patients, suggesting that no single level of activity dominates the group. Activity levels around 3 to 5 have slightly more patients (about 120), indicating that a moderate level of physical activity may be common in this group of patients. The green density line illustrates some fluctuations in the data, but overall, there are no extreme peaks or dominant values, reflecting a relatively flat distribution.
Smoking vs Diagnosis
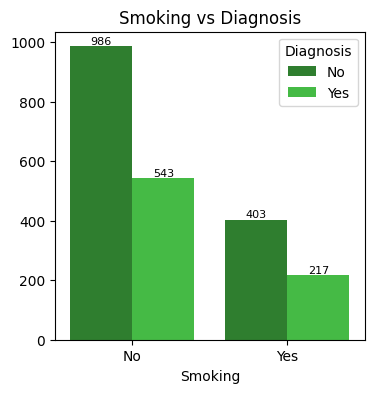
Comment: For both smokers and non-smokers, there are more patients without an Alzheimer’s diagnosis. However, the difference is more pronounced among non-smokers, where the gap between diagnosed and non-diagnosed is larger.
This visualization suggests a potential association between smoking and Alzheimer’s diagnosis, though further analysis would be required to understand if smoking is a significant risk factor or if other variables play a more critical role.
Alcohol Consumition, Diet Quality and Physical Activity vs Diagnosis

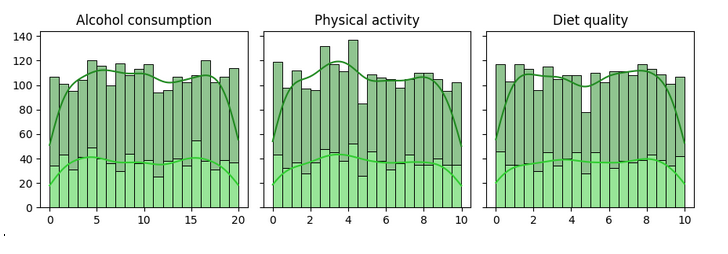
Comment:
The graph presents a comparison between patients not diagnosed with Alzheimer’s (represented by dark green) and those diagnosed with the disease (bright green) in terms of several lifestyle factors.
* Alcohol Consumption: Both groups exhibit a similar distribution for alcohol consumption, suggesting that this factor is not correlated with Alzheimer’s diagnosis.
* Physical Activity: A similar pattern is observed regarding physical activity, indicating that maintaining an active lifestyle does not show a clear association with the likelihood of being diagnosed with Alzheimer’s.
* Diet Quality: The distribution of diet quality also appears to be similar across both diagnosed and non-diagnosed patients, suggesting no correlation between diet and the frequency of Alzheimer’s diagnosis.
While these visual patterns indicate no apparent association between these lifestyle factors and Alzheimer’s diagnosis, statistical tests are necessary to confirm the null hypothesis that there is no significant relationship between these variables and the diagnosis.
Smoking
Chi-square Test
Null Hypothesis: There is no association between smoking and diagnosis.
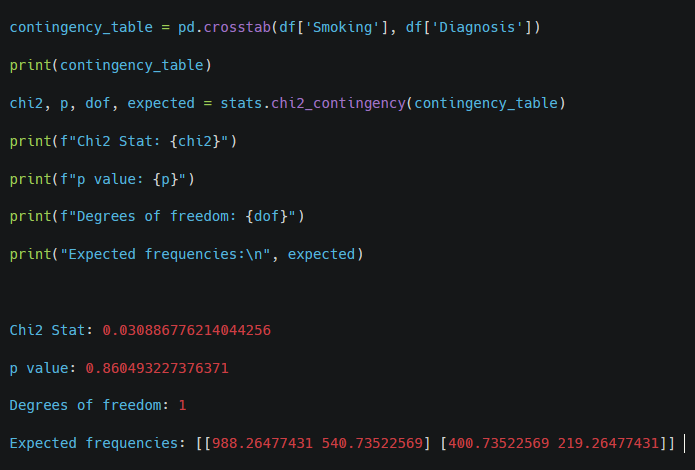
Comment: With a p-value of 0.860, which is much higher than the typical significance level (e.g., 0.05), we fail to reject the null hypothesis. This indicates that there is no statistically significant association between smoking and Alzheimer’s diagnosis in this dataset.
Alcohol Consumption
Logistic Regression
Null Hypothesis: There is no association between alcohol consumption and diagnosis.
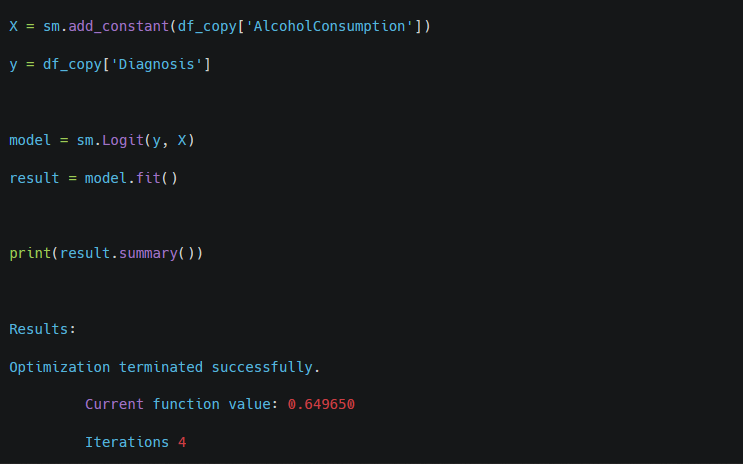
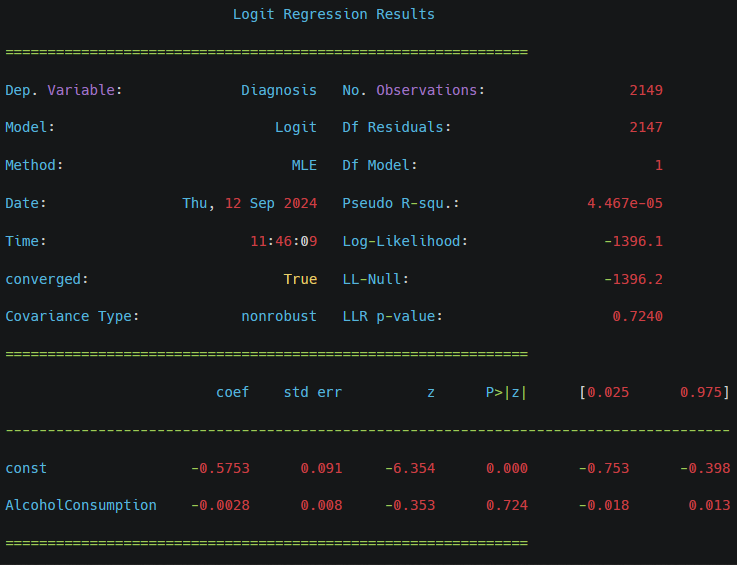
Comment: The coefficient (-0.0028) is very close to zero, suggesting a negligible effect of alcohol consumption on the likelihood of being diagnosed with Alzheimer’s disease.
The p-value for the alcohol consumption variable is 0.724, which is significantly higher than the typical significance level (e.g., 0.05).
With a high p-value, we fail to reject the null hypothesis. This indicates that there is no statistically significant association between alcohol consumption and Alzheimer’s diagnosis in this dataset.
Diet Quality
Logistic Regression
Null Hypothesis: There is no association between diet quality and diagnosis.
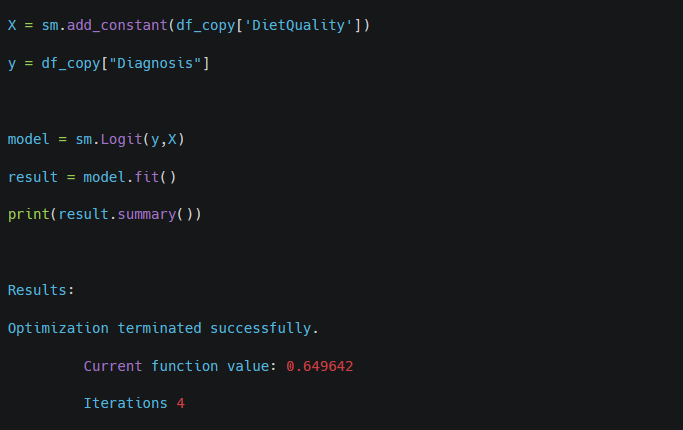
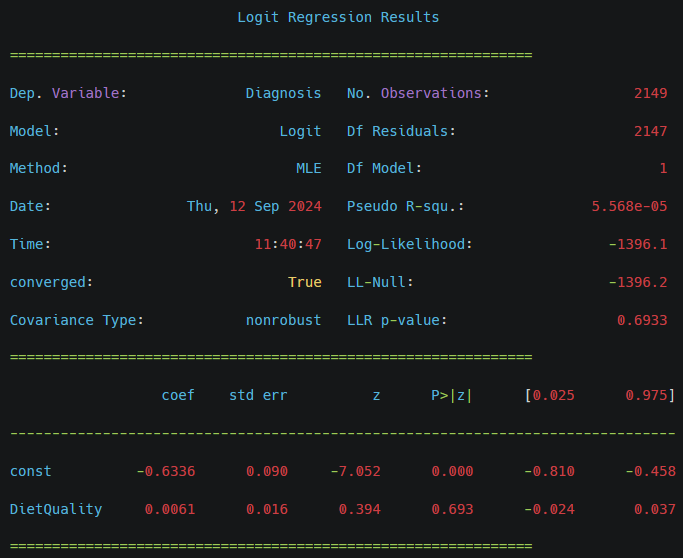
Comment: Diet quality does not appear to have a significant impact on the Alzheimer’s diagnosis in this model, as indicated by the p-value greater than 0.05. The very low pseudo R-squared value also suggests that the model explains very little of the variance in the diagnosis.
With a high p-value, we fail to reject the null hypothesis
Physical Activity
Logistic Regression
Null Hypothesis: There is no association between physical activity and diagnosis.
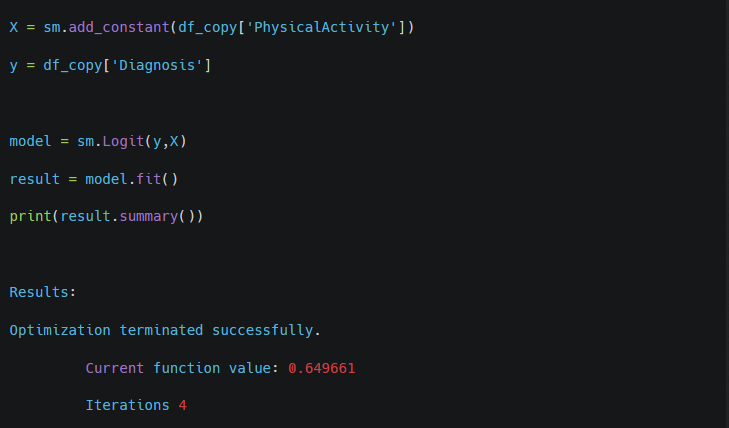
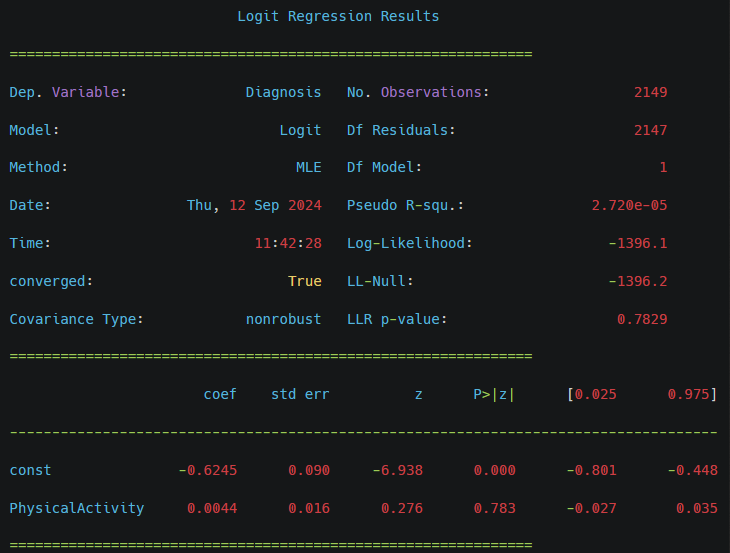
Comment: The coefficient (0.0044) is close to zero, indicating a minimal effect of physical activity on the likelihood of being diagnosed with Alzheimer’s disease.
The p-value for physical activity is 0.783, which is much higher than the standard significance level (e.g., 0.05).
With a high p-value, we fail to reject the null hypothesis. This suggests that there is no statistically significant association between physical activity and Alzheimer’s diagnosis in this dataset.
– Which lifestyle habits (smoking, alcohol use, diet, physical activity) are associated with a higher or lower risk of developing Alzheimer’s disease?
Chi-square Tests and Logistic Regression: No significant associations found between smoking, alcohol consumption, diet quality, or physical activity and Alzheimer’s diagnosis.
Note: Different datasets or additional factors might reveal different relationships. Lifestyle habits might also interact with other factors not captured in this dataset.
4.3 Are individuals with a family history of Alzheimer’s more likely to develop the disease than those without a family history?
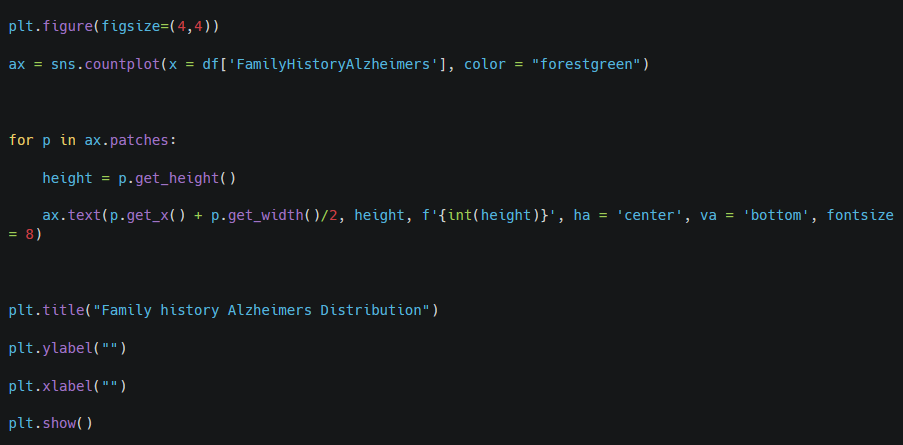
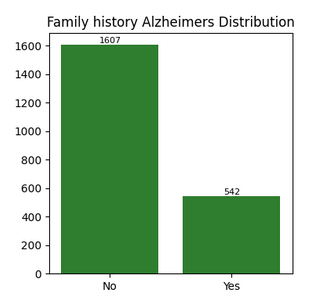
Comment: The bar chart illustrates the distribution of patients based on family history status, with 1607 patients without Alzheimer’s case in their family and 542 patients with confirmed family history Alzheimer’s.
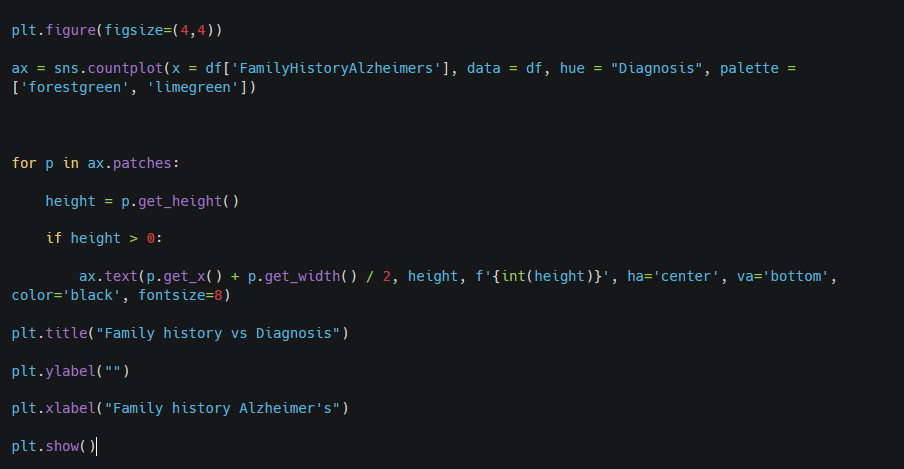
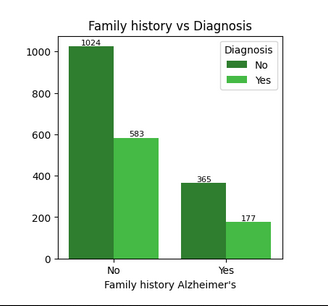
Comment: The graph indicates that individuals without a family history of Alzheimer’s are more frequently diagnosed, which is counterintuitive.
Chi-Squared
Null Hypothesis: There is no association between family history Alzheimer’s and diagnosis.
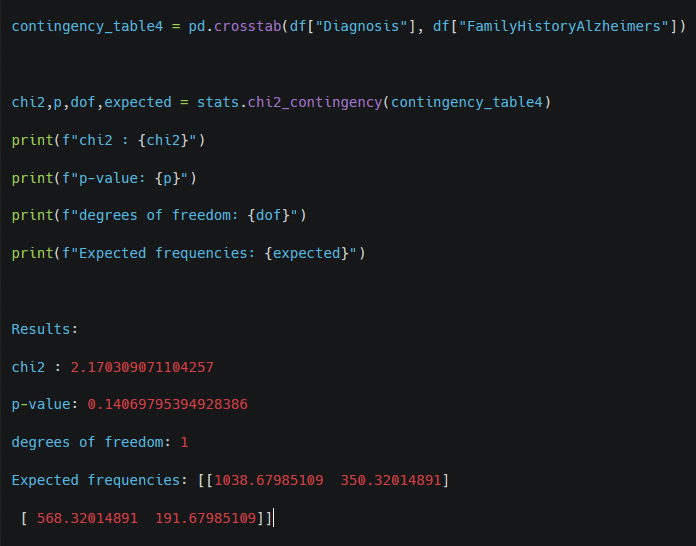
Comment: With a p-value of 0.141, which is greater than the common significance level (e.g., 0.05), we fail to reject the null hypothesis. This indicates that there is no statistically significant association between having a family history of Alzheimer’s disease and being diagnosed with the disease in this dataset.
– Are individuals with a family history of Alzheimer’s more likely to develop the disease than those without a family history?
Chi-square Tests and Logistic Regression: No significant association found between family history and Alzheimer’s diagnosis.
Note: Family history is a known risk factor in other studies, but this dataset does not show a significant association.
4.4 Do individuals with comorbid conditions have a higher risk of Alzheimer’s compared to those without these conditions?
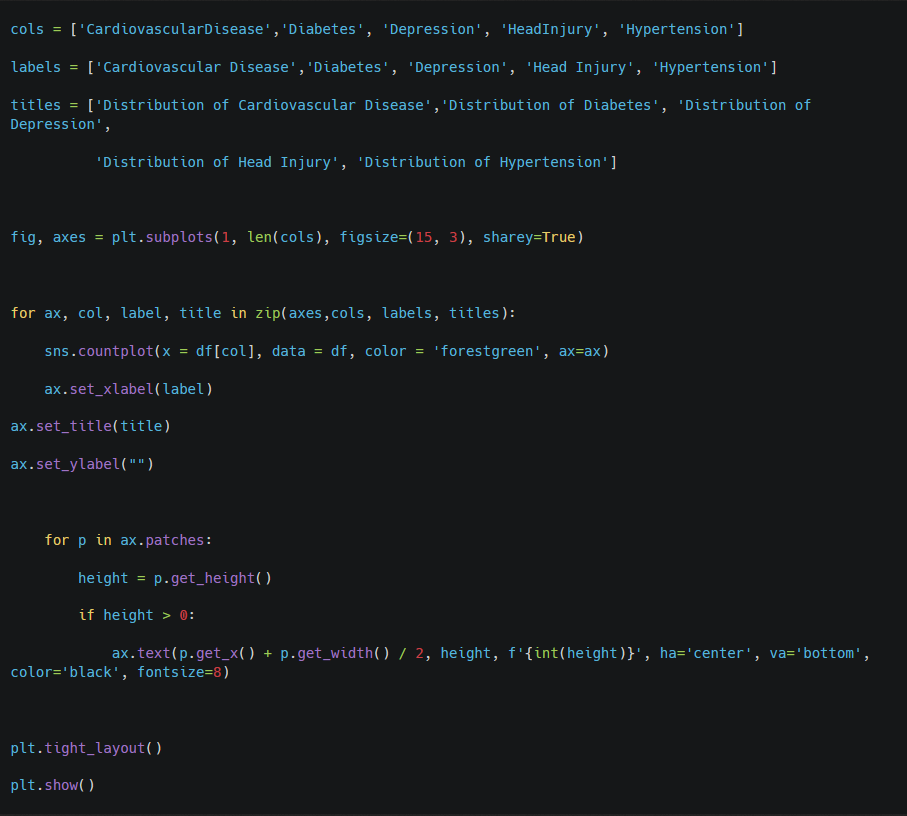
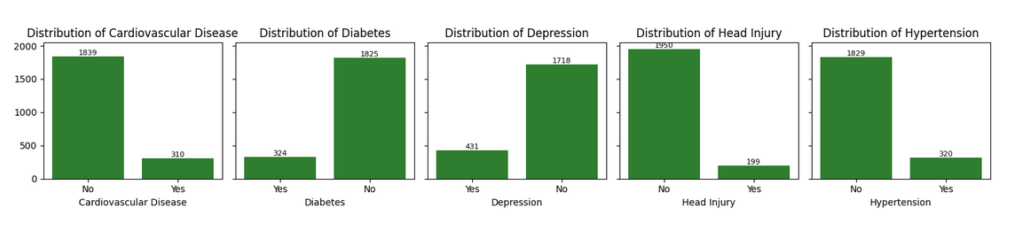
Comment: The graph suggests that in this dataset, most patients do not suffer from cardiovascular disease, diabetes, depression, or hypertension, indicating that comorbid conditions are relatively uncommon among the population studied. Additionally, the low number of patients with a history of head injury further supports the notion that this dataset may not represent individuals with a high prevalence of these specific health issues.

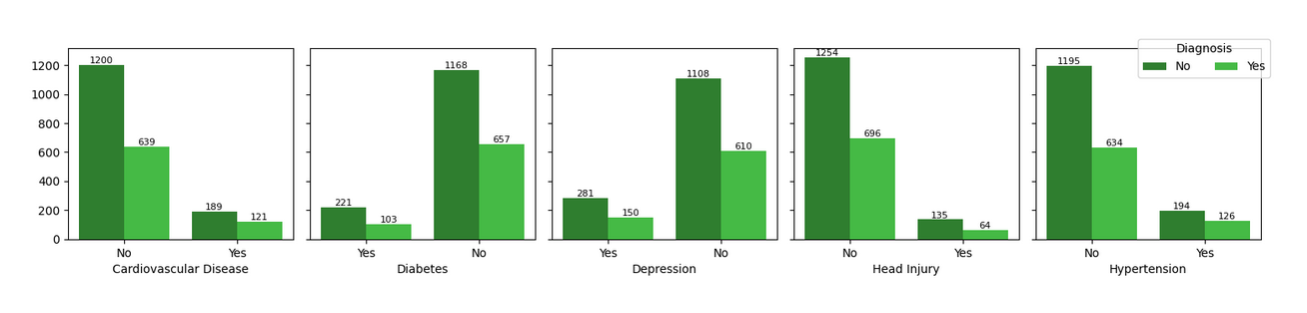
Comment:
* People without cardiovascular disease have a significantly higher rate of Alzheimer’s diagnosis, which seems contrary to some existing literature that links cardiovascular health to cognitive decline. This suggests that in this dataset, cardiovascular disease might not play as strong a role in Alzheimer’s development as in other studies.
* Individuals without diabetes have more Alzheimer’s diagnoses. This is an interesting finding because diabetes is often considered a risk factor for cognitive decline.
* The distribution suggests that depression may not have a straightforward correlation with Alzheimer’s diagnosis.
* A head injury, often considered a risk factor for Alzheimer’s, does not seem to exhibit a strong correlation in this dataset.
* Hypertension doesn’t seem to be a protective factor, as non-hypertensive individuals have a much higher rate of Alzheimer’s diagnosis. This might indicate that hypertensive individuals may have other conditions that prevent them from living long enough to develop Alzheimer’s.
Diabetes
Chi-squared Test
Null Hypothesis: There is no association between diabetes and diagnosis.
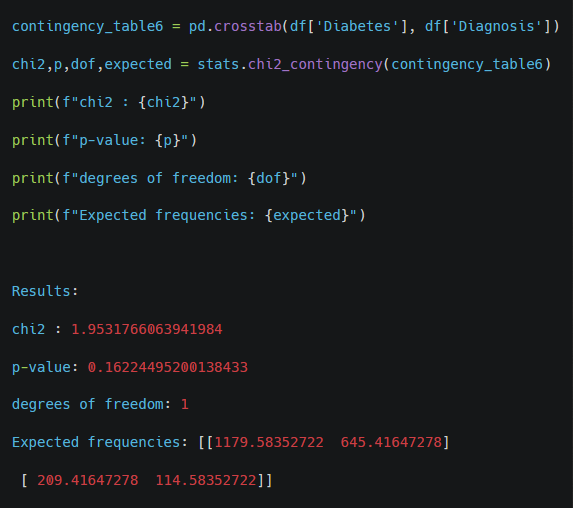
Comment: With a p-value of 0.162, which is greater than the typical significance level (e.g., 0.05), we fail to reject the null hypothesis. This suggests that there is no statistically significant association between diabetes and Alzheimer’s diagnosis in this dataset.
Cardiovascular Disease
Chi-squared Test
Null Hypothesis: There is no association between cardiovascular disease and diagnosis.
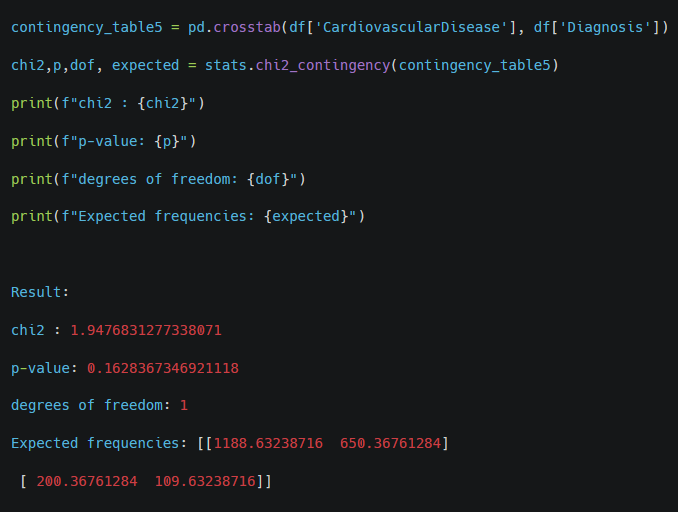
Comment: With a p-value of 0.163, which is greater than the typical significance level (e.g., 0.05), we fail to reject the null hypothesis. This means there is no statistically significant evidence to suggest an association between cardiovascular disease and Alzheimer’s diagnosis in this dataset.
Depression
Chi-squared Test
Null Hypothesis: There is no association between depression and diagnosis.
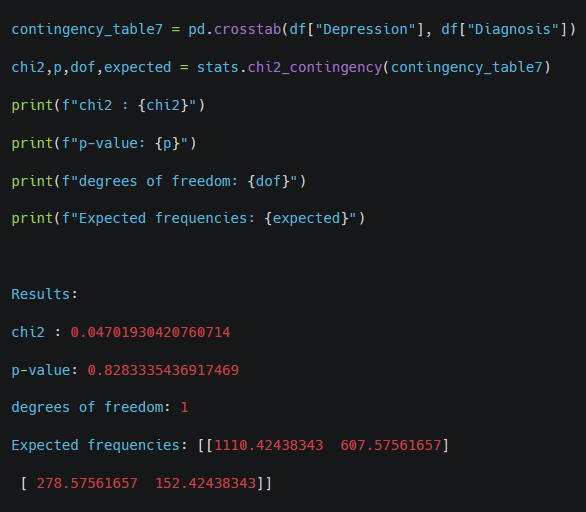
Comment: With a p-value of 0.828, which is greater than the typical significance level (e.g., 0.05), we fail to reject the null hypothesis. This suggests that there is no statistically significant association between depression and Alzheimer’s diagnosis in this dataset.
Head Injury
Chi-squared Test
Null Hypothesis: There is no association between head injury and diagnosis.
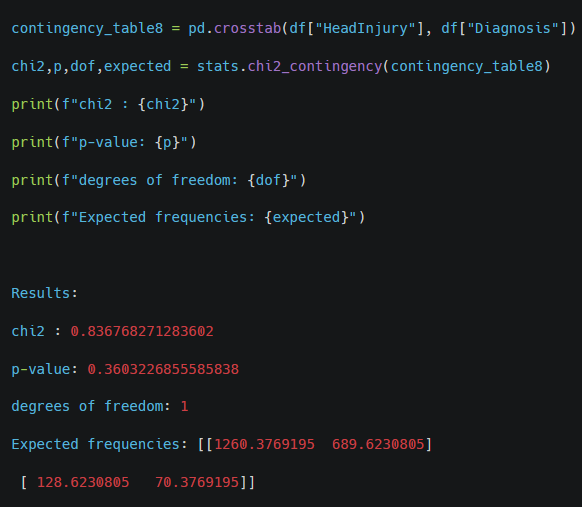
Comment: With a p-value of 0.360, which is greater than the typical significance level (e.g., 0.05), we fail to reject the null hypothesis. This suggests that there is no statistically significant association between head injury and Alzheimer’s diagnosis in this dataset.
Hypertension
Chi-squared Test
Null Hypothesis: There is no association between hypertension and diagnosis.
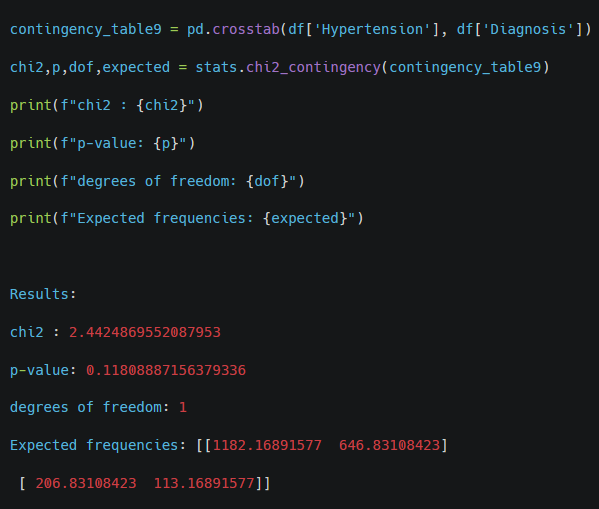
Comment: With a p-value of 0.118, which is greater than the typical significance level (e.g., 0.05), we fail to reject the null hypothesis. This suggests that there is no statistically significant association between hypertension and Alzheimer’s diagnosis in this dataset.
– Do individuals with comorbid conditions have a higher risk of Alzheimer’s compared to those without these conditions?
Chi-square Tests: No significant association found between comorbid conditions and Alzheimer’s diagnosis.
Note: This result might differ with a larger or more diverse dataset.
4.5 Which clinical measurements and their results increase the risk of Alzheimer’s?
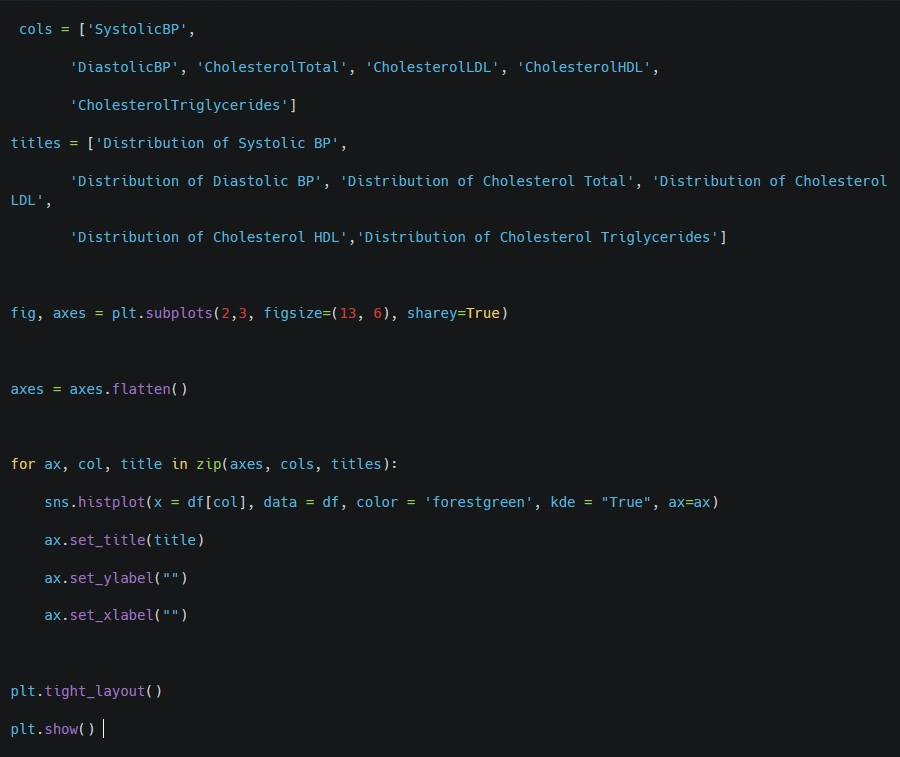
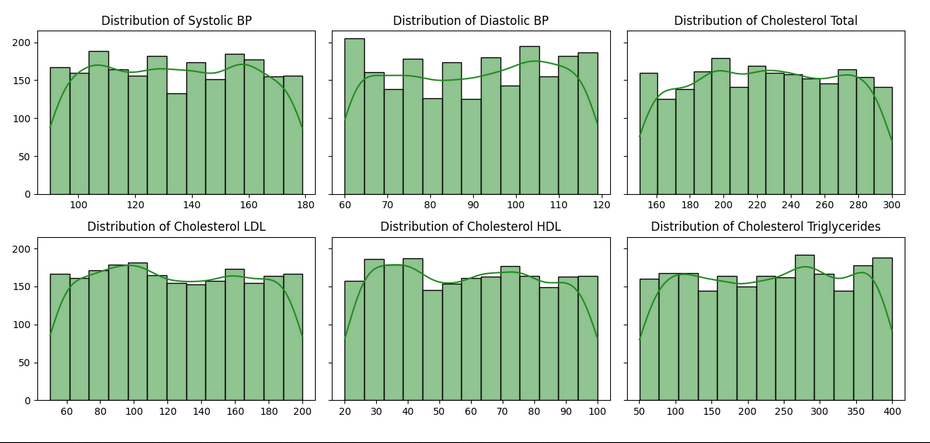
Comment: The distributions of systolic and diastolic BP, as well as cholesterol measures, show a spread across a wide range of values. Most of these histograms suggest relatively uniform distributions, with some mild peaks in certain ranges (such as LDL and total cholesterol).
Systolic BP, Diastolic BP, Total Cholesterol, LDL, HDL, Triglycerides vs Diagnosis

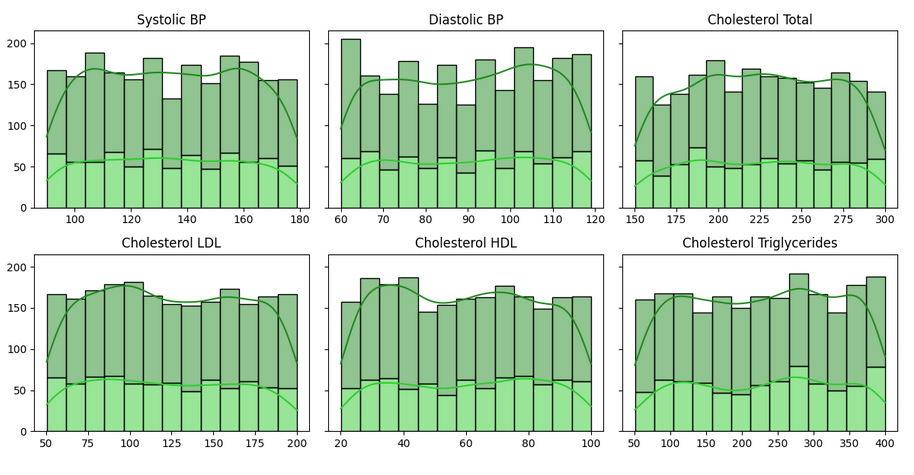
Comment: The histograms for the various measurements (Systolic BP, Diastolic BP, Total Cholesterol, LDL, HDL, Triglycerides) indicate that there are similar patterns in the distributions of these variables for both diagnosed (dark green) and non-diagnosed (light green) patients.
This similarity implies that these measurements may not be the most effective indicators for distinguishing between Alzheimer’s diagnosis and non-diagnosis.
Q-Q Test for Normal Distribution
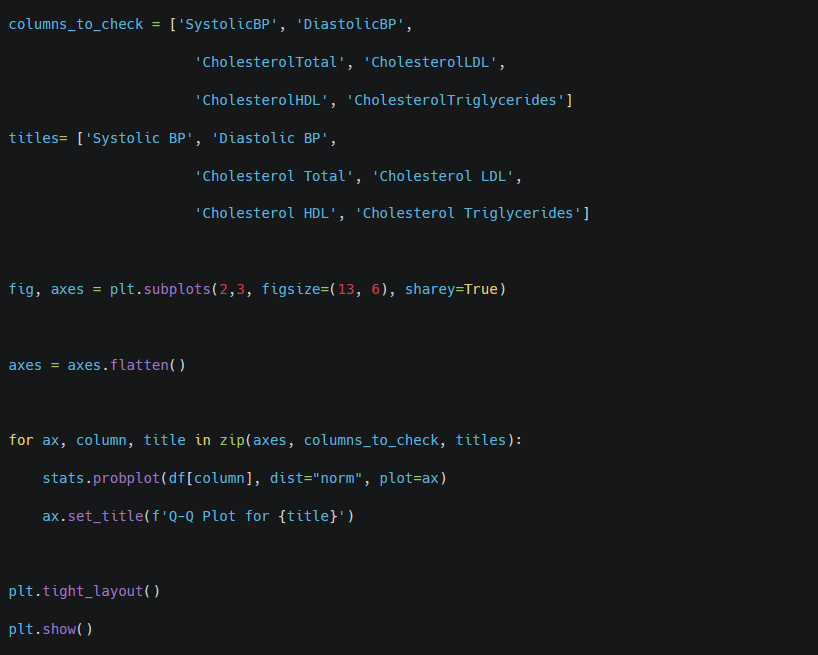
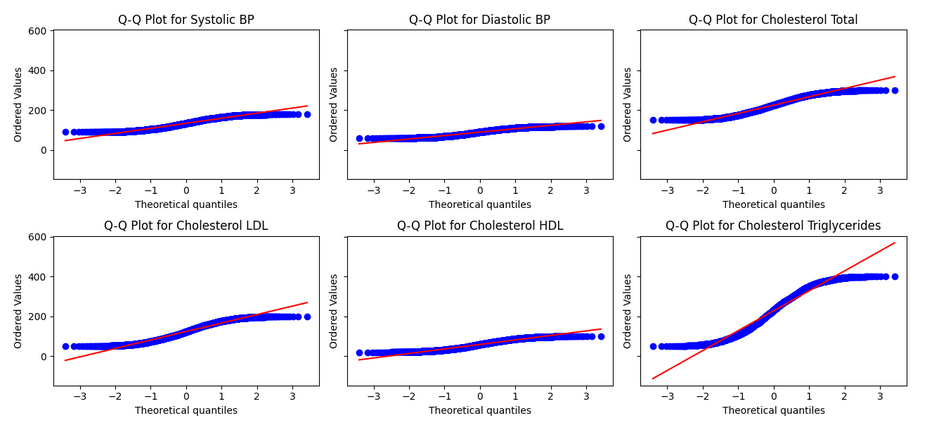
Comment: The distributions of tested columns are not normal – the non parametrical tests must be performed.
Mann-Whitney U Test
Null Hypothesis: There is no significant differences in the distributions of ‘SystolicBP‘, ‘DiastolicBP‘, ‘CholesterolTotal‘, ‘CholesterolLDL‘, ‘CholesterolHDL‘ and ‘CholesterolTriglycerides‘ between patients diagnosed with Alzheimer’s and those without a diagnosis.
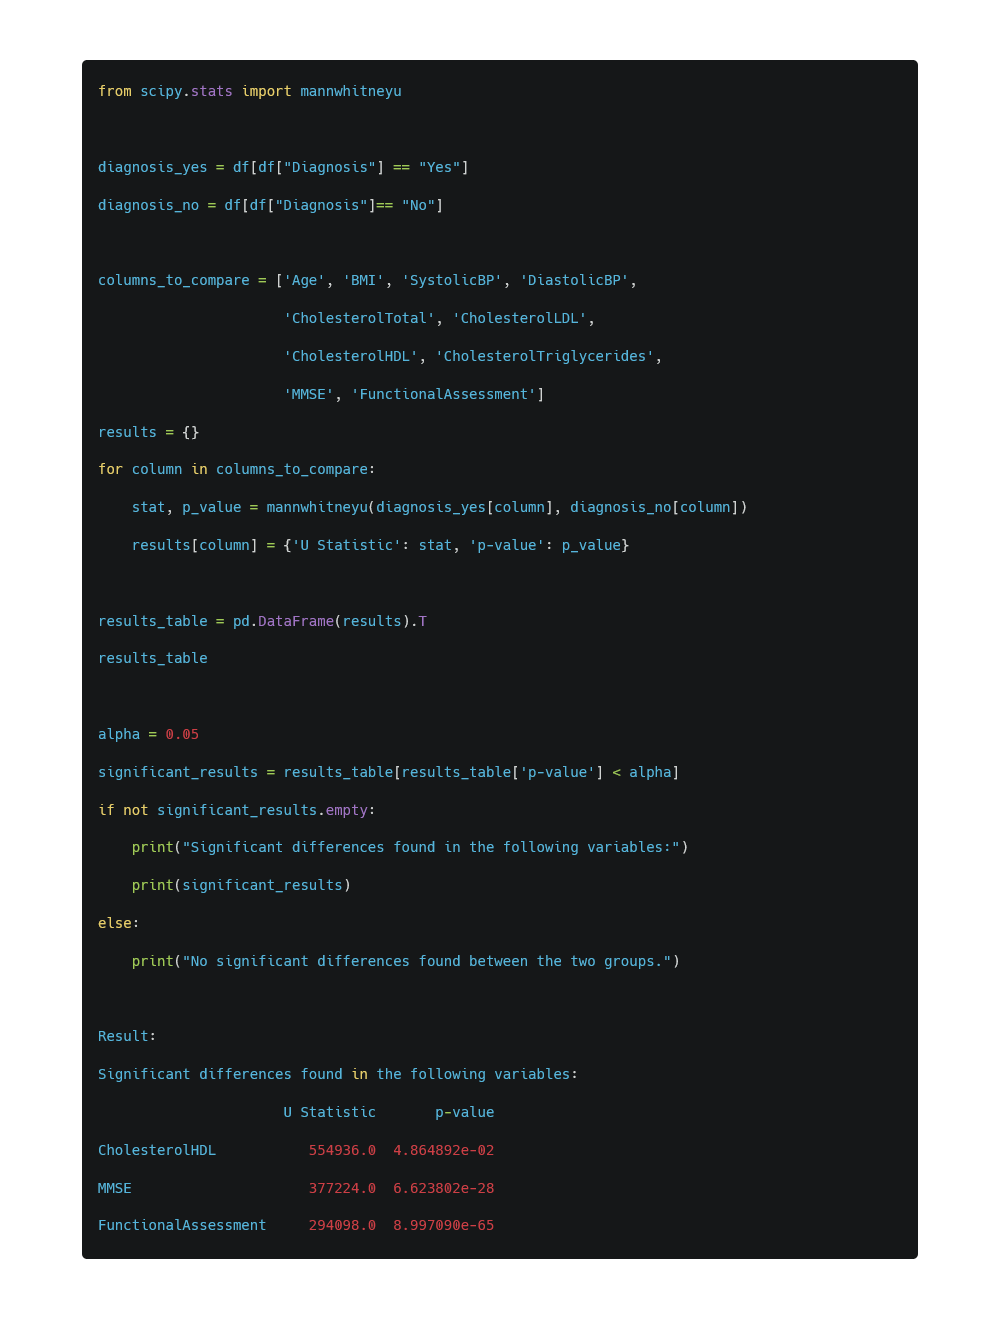
Comment:
The Mann-Whitney U test was performed to compare the distributions of various measurements between patients diagnosed with Alzheimer’s (Yes) and those without (No). The results indicate which variables have significant differences in their distributions between the two groups.
Cholesterol HDL, MMSE, and Functional Assessment exhibit significant differences between patients with and without Alzheimer’s diagnosis.
The other variables in the dataset (e.g., Systolic BP, Diastolic BP, Cholesterol Total, LDL, Triglycerides) do not show significant differences between the two groups based on the Mann-Whitney U test. .
Check which group has higher CholesterolHDL, MMSE and FunctionalAssessment:
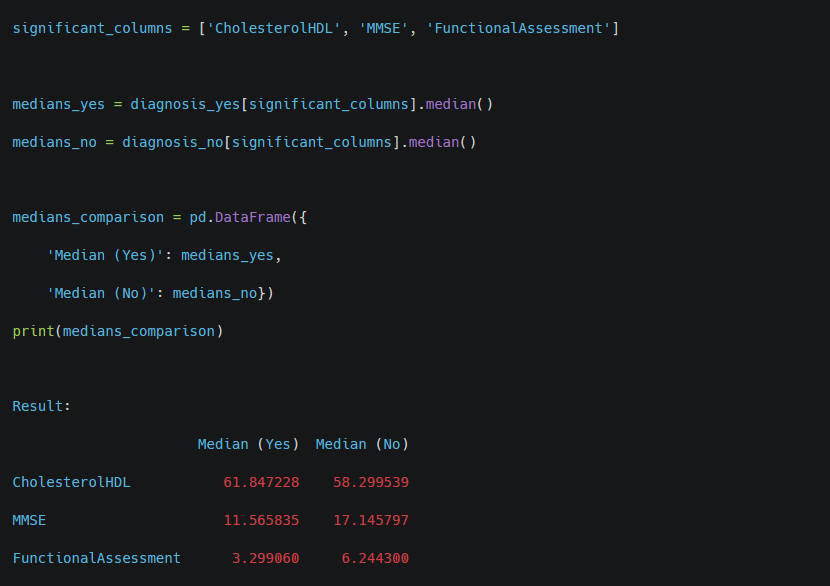
Comment:
The Mann-Whitney U test was performed to compare the distributions of various measurements between patients diagnosed with Alzheimer’s (Yes) and those without (No). The results indicate which variables have significant differences in their distributions between the two groups.
Cholesterol HDL, MMSE, and Functional Assessment exhibit significant differences between patients with and without Alzheimer’s diagnosis.
The other variables in the dataset (e.g., Systolic BP, Diastolic BP, Cholesterol Total, LDL, Triglycerides) do not show significant differences between the two groups based on the Mann-Whitney U test. .
– Do individuals with comorbid conditions have a higher risk of Alzheimer’s compared to those without these conditions?
The Mann-Whitney U Test shows that Cholesterol HDL, MMSE, and Functional Assessment exhibit significant differences between patients with and without Alzheimer’s diagnosis.
5. Methodology
5.1 Prediction of the likelihood of Alzheimer’s disease diagnosis using logistic regression.
Logistic regression is a classification algorithm used to predict a binary outcome (e.g., whether or not an individual is diagnosed with Alzheimer’s disease). It estimates the probability of a particular event occurring using the logistic function. The output of the model is a value between 0 and 1, which can be interpreted as the probability of the event happening (in this case, the probability of a positive diagnosis).
Before training the model, the numerical features are normalized using the StandardScaler. This method standardizes the features by removing the mean and scaling to unit variance. Standardization ensures that all variables contribute equally to the model and helps prevent some variables from dominating due to their magnitude.
The dataset is split into training and testing sets using the train_test_split function. 80% of the data is used for training the model, and 20% is set aside for testing. The reason for this split is to evaluate the model’s generalization capability on unseen data. The random state is set to ensure reproducibility of results.
After training, the model’s performance is evaluated using:
* Accuracy Score: This metric measures the percentage of correctly predicted outcomes among all predictions. * Classification Report: This provides more detailed metrics, including precision, recall, F1-score, and support for each class. These metrics help assess how well the model predicts both positive and negative outcomes, providing a more nuanced understanding of performance.
Logistic Regression was chosen because it is a well-established method for binary classification problems like predicting the likelihood of a disease diagnosis.
Normalization (StandardScaler) was used because the logistic regression model assumes that the features are scaled similarly. Without normalization, features with larger scales could disproportionately influence the model’s predictions, leading to biased results.
Train-test split ensures that the model’s performance is evaluated on unseen data. Evaluation metrics like accuracy, precision, recall, and F1-score provide a comprehensive assessment of the model. They were chosen to ensure the model not only predicts accurately but also balances between predicting positive and negative classes effectively, especially given the importance of correctly identifying Alzheimer’s cases.

Comment:
The model correctly predicts 78% of the cases, meaning that overall, the model performs reasonably well in predicting both positive (Alzheimer’s) and negative (No Alzheimer’s) cases.
For class 0 (No Alzheimer’s), precision is 0.82, indicating that 82% of the patients predicted as healthy are actually healthy. For class 1 (Alzheimer’s), precision is 0.72, meaning that 72% of the patients predicted as having Alzheimer’s actually have the disease. For class 0, recall is 0.85, showing that 85% of healthy patients were correctly identified by the model. For class 1, recall is 0.67, which means the model correctly identifies 67% of the Alzheimer’s patients, but misses 33%.
6. Results Analysis
The analysis aimed to explore various factors and their association with the diagnosis of Alzheimer’s disease. Several demographic, lifestyle, and health-related variables were investigated, and the following conclusions were drawn:
Demographic Factors:
Ethnicity, Gender, and Education Level: The chi-square tests did not find any significant association between these demographic factors and the diagnosis of Alzheimer’s disease. This suggests that, within this dataset, these variables do not play a significant role in predicting Alzheimer’s.
Age: Contrary to many studies that indicate age as a major risk factor, logistic regression analysis showed that age did not have a significant impact on Alzheimer’s diagnosis in this dataset. It is possible that the dataset lacks sufficient variation across age groups, or the relationship between age and Alzheimer’s may be non-linear. Further investigation with a more varied dataset might provide more insight.
Lifestyle Habits:
Smoking, Alcohol Consumption, Diet Quality, and Physical Activity: Both chi-square tests and logistic regression failed to reveal any significant associations between these lifestyle factors and Alzheimer’s diagnosis. This does not necessarily imply that these habits are not related to Alzheimer’s risk, but rather that this specific dataset may not capture those associations. Other datasets or interactions with additional factors could present different results.
Family History:
The chi-square test did not show a significant association between a family history of Alzheimer’s and the diagnosis of the disease. While family history is often considered a key risk factor in the literature, this dataset did not reflect that relationship. It may be due to the sample size or other limitations within the dataset.
Comorbid Conditions:
No significant associations were found between comorbid conditions and Alzheimer’s diagnosis according to the chi-square tests. While other studies suggest that comorbidities can increase Alzheimer’s risk, this dataset does not demonstrate that relationship. A larger or more diverse dataset might yield different results.
7. Conclusions
The findings from this dataset indicate that many well-known risk factors for Alzheimer’s disease did not show statistically significant associations with the diagnosis. This might be due to the specific nature of the dataset used, which could lack variation or sufficient sample size in critical areas. Future research with larger and more diverse datasets might reveal different or more pronounced relationships, especially concerning age and family history.
8. Additional Information
Power BI Dashboard
To calculate the impact of medical history factors, I created six measures that determine the percentage of Alzheimer’s patients with these factors in their history. Example:
PercentageOfCardioVascularDiseaseWithDiagnosis =
DIVIDE(
CALCULATE(
COUNTROWS(‘Alzheimer»s clean’),
‘Alzheimer»s clean'[CardiovascularDisease] = «Yes»,
‘Alzheimer»s clean'[Diagnosis] = «Yes»
), [Positive Diagnosis])
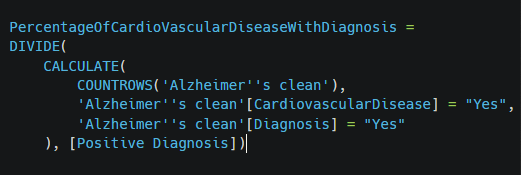
Overall, this measure provides insights into how many of the diagnosed Alzheimer’s patients also have a history of cardiovascular disease, expressed as a percentage of all positive Alzheimer’s diagnoses.
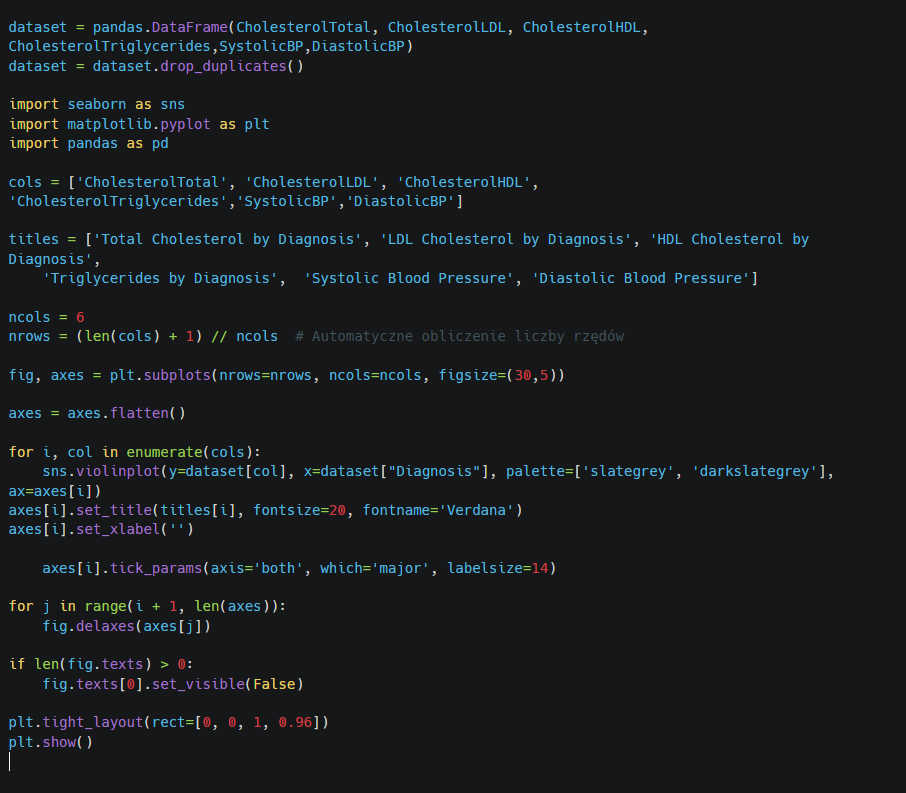
I used a Python visual function to create violin plots that visualize clinical measurements for both groups: patients diagnosed with Alzheimer’s disease and those without a diagnosis.
I also created a histogram to display the distribution of Mini-Mental State Examination results among patients with a diagnosis of Alzheimer’s disease and those without a diagnosis.