Bike Store Sales Analysis
Marta Kowalczyk
1. Introduction
This project focuses on analyzing data from a bike store using MySQL. The objective was to explore key business metrics, identify trends, and derive actionable insights from the store’s dataset. By leveraging SQL queries, the analysis delves into various aspects such as sales performance, product popularity, customer preferences, and inventory management.
Key analyses include:
- Identifying Top-Selling products.
- Understanding purchasing patterns.
- Evaluating inventory efficiency.
Through this project, SQL techniques like aggregation, joins, window functions, cte’s and conditional filtering were employed to extract meaningful insights. The findings provide a foundation for data-driven decision-making, helping the store optimize its sales strategy and inventory management.
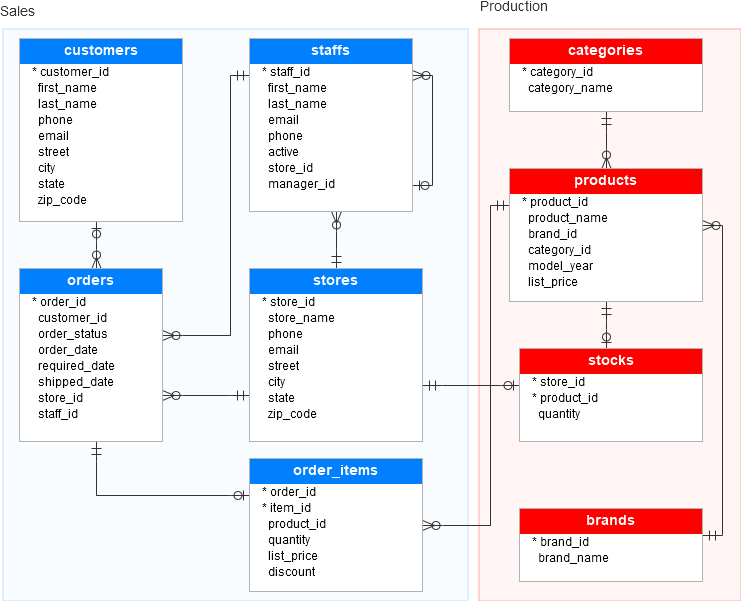
2. Data Description
The database was found on Kaggle (https://www.kaggle.com/datasets/dillonmyrick/bike-store-sample-database) and the original data is from sqlservertutorial.net (https://www.sqlservertutorial.net/getting-started/sql-server-sample-database/).
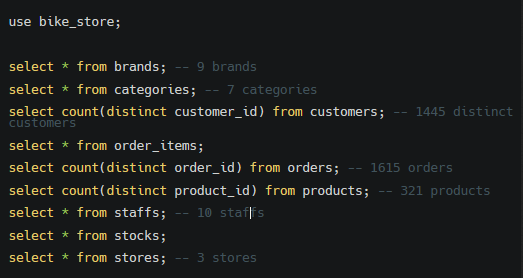
It contains 9 tabels:
3. Exploratory Data Analysis
What products are the most expensive and the cheapest?
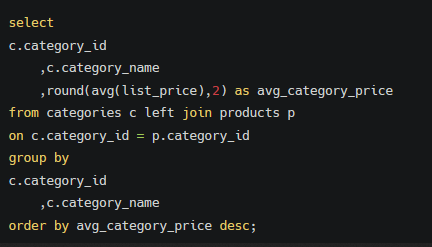
Comment:
Electric bikes and Road bikes are the most expensive (avg price respectively 3281,66 and 3175,36). The cheapest are Chlidren bicycles (287,79)
How many different products do we have in each category?
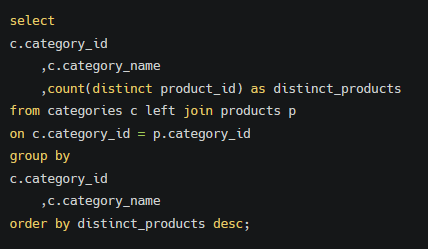
Comment:
The biggest choice is of Cruisers bicycles, then Mountain bikes, Road bikes and Children Bikes. There are only 10 models of cyclocross bicycles to choose from.
Which brand offer the most products?
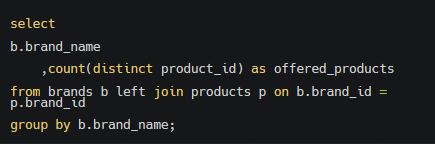
Comment:
Trek (135), Electra (118), the rest below 25. Ritchey offers only 1 product
The range of orders
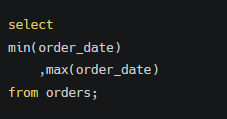
Comment:
First order: 2016-01-01 – Last order: 2018-12-28
4. Data Analysis
1. Sales Analysis
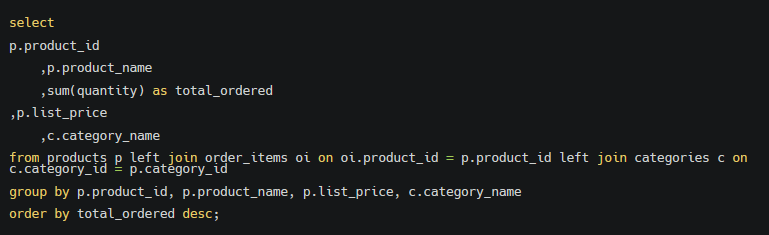
Which products sell the most (in terms of quantity and revenue)?
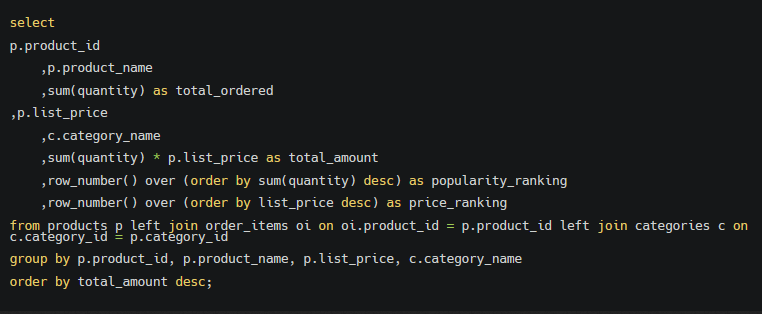
Comment:
Most profitable is ‘Trek Slash 8 27.5 – 2016‘ – it’s 4th the most popular model and 26th the most expensive model. It generated income of 615.998,46 (no discount included)
Other top sellers are ‘Trek Conduit+ – 2016‘ (145 sold, unit price 2999,99, in total 434.998,55) and ‘Trek Fuel EX 8 29 – 2016‘ (143 sold, unit price 2899,99, total 414.698,57)
How many products haven’t been ordered yet?
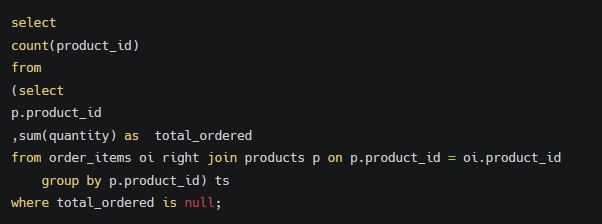
Comment:
There are 14 models that haven’t been ordered yet.
What are the most popular bike models among customers?
Comment:
The most popular models are ‘Surly Ice Cream Truck Frameset – 2016′, ‘Electra Cruiser 1 (24-Inch) – 2016‘, ‘Electra Townie Original 7D EQ – 2016‘, ‘Trek Slash 8 27.5 – 2016‘
‘Electra Girl»s Hawaii 1 (20-inch) – 2015/2016‘, ‘Electra Townie Original 21D – 2016′, and ‘Surly Straggler 650b – 2016‘ (over 150 ordered). ‘Trek Slash 8 27.5 – 2016‘ was sold 154 times although it’s high price (3999,99)
What are the most popular bike categories among customers?
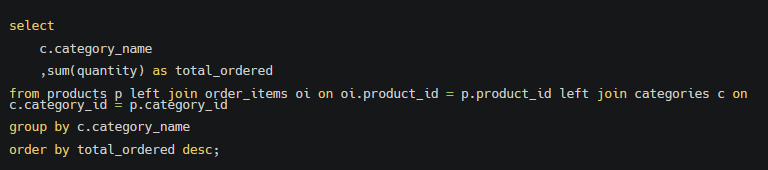
Comment:
The most popular categories are ‘Cruisers Bicycles’ and ‘Mountain Bikes‘
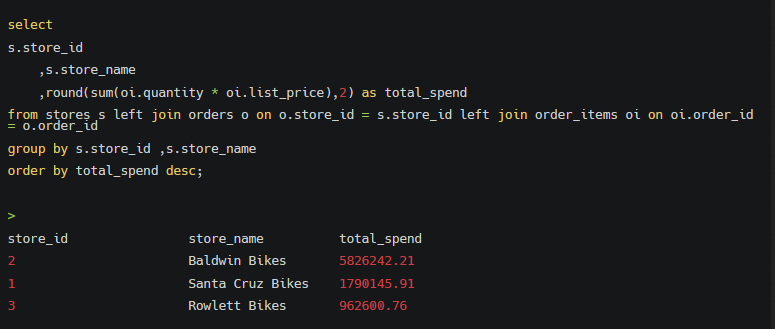
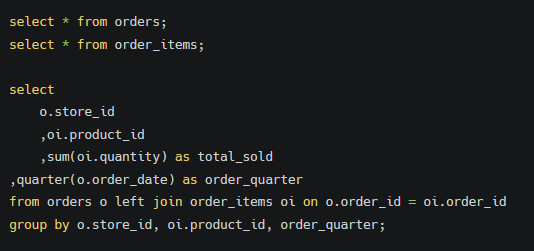
Sales performance by store – which store generates the highest revenue?
2. Customer Analysis
How many customers returned?
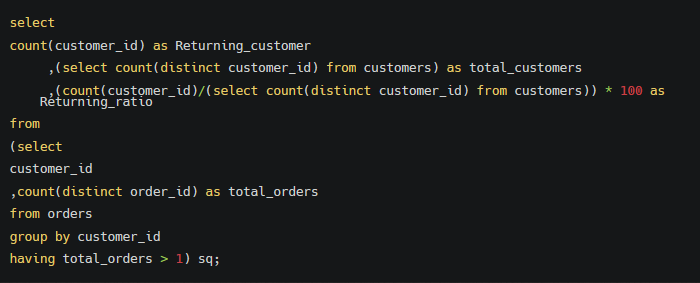
Comment:
131 customers ordered twice or more, 9% of all.
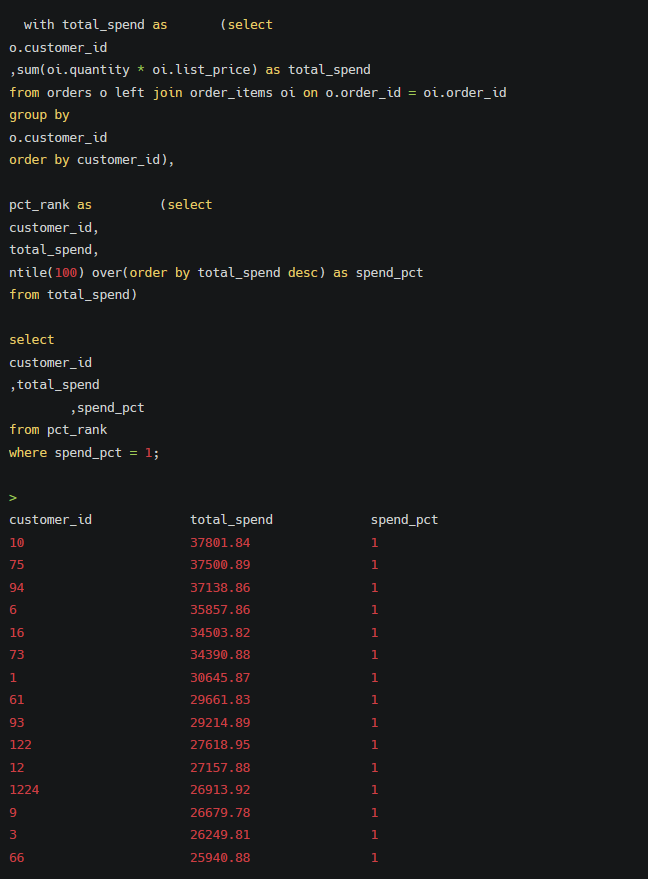
Customer segmentation based on order value (identifying TOP 1% customers).
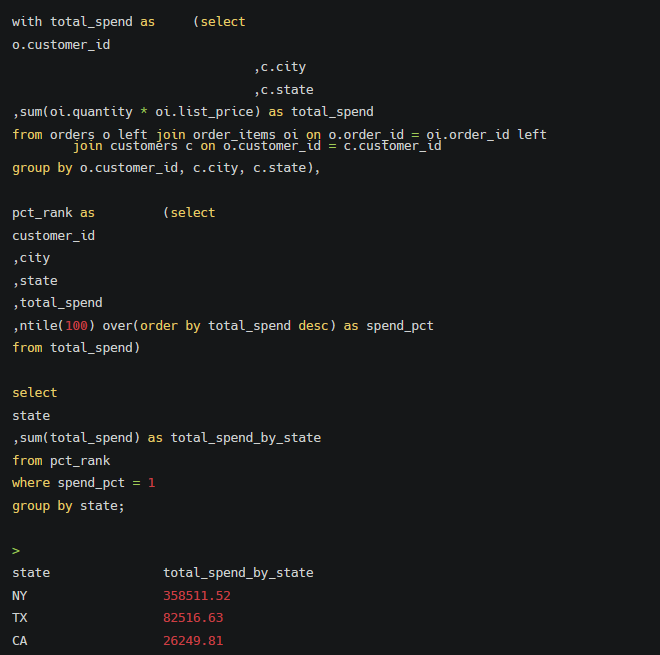
Analysis of customer locations – where are the most valuable customers from?
3. Inventory Analysis
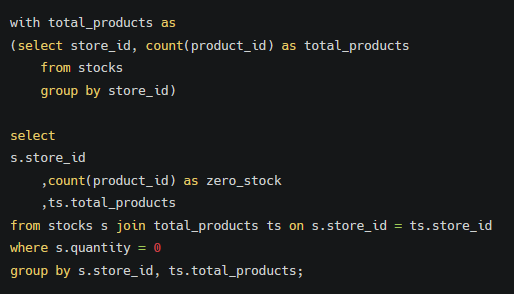
Which products have the lowest stock levels?
Comment:
Stores #1 and #2 each have 10 products out of stock, while Store #3 has only 5 products missing.
Which products are overstocked and not selling well?
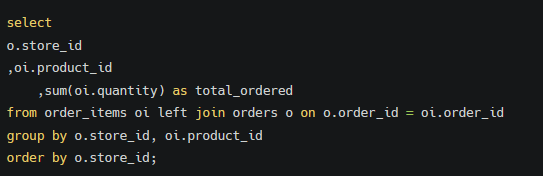
– How many products were ordered in total in each store?
Comment:
What does it mean «overstocked«? For the purpose of this analysis, I will consider the average quarterly sales as the level 0, and products stored in higher quantity than average quarterly sales of certain products +3 will be „overstocked”
– Which products are overstocked?
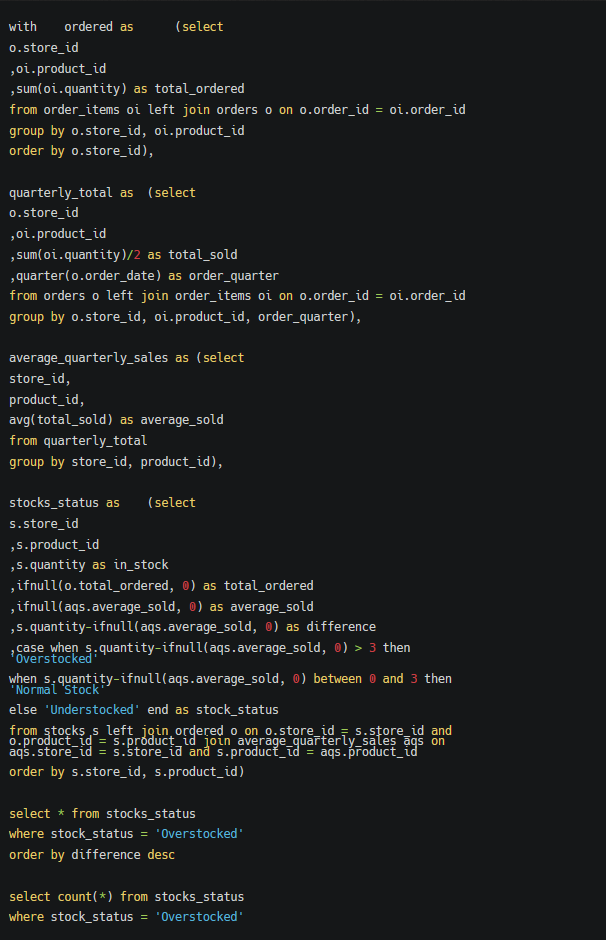
Comment:
There are 536 overstocked products.
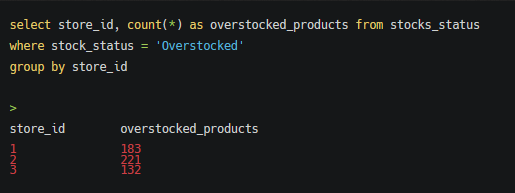
Comment:
Store 2 shows the largest issue with overstocked products, possibly due to overordering or low demand.
– Understocked products:
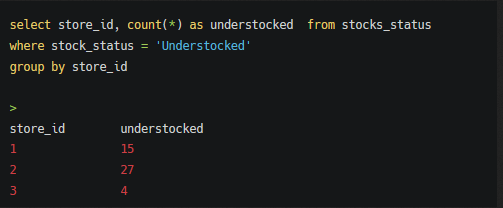
Comment:
Store 2 also has the most understocked products, highlighting potential issues with inventory management or demand forecasting.
4. Seasonality Analysis
Does bike sales vary depending on the season?
Comment:
As a first order from the dataset was made 2016-01-01, and last one 2018-12-28, there are 3 full years of active sales (no risk of count some months more than the others)
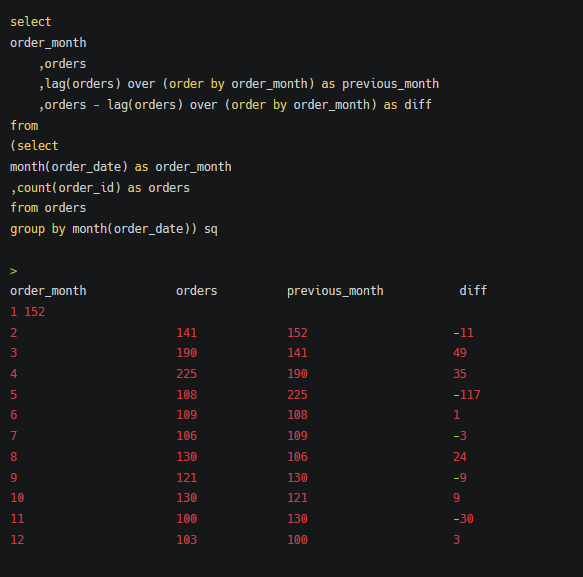
Comment:
The data shows that the highest interest in ordering bikes was observed in January, February, March, and April. This suggests that demand is higher at the beginning of the year, possibly due to the approaching spring season or New Year’s resolutions.
Comment:
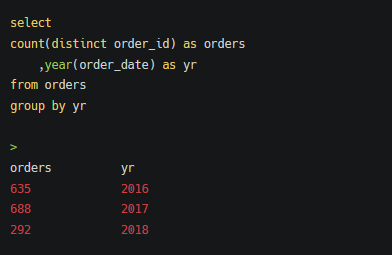
The summary shows that while orders were relatively consistent between 2016 (635 orders) and 2017 (688 orders), there was a significant drop to only 292 orders in 2018, despite the dataset covering a nearly complete three-year period. This discrepancy indicates an unusual decline in 2018 that warrants further investigation.
5. Cross-Selling Opportunities
Analyzing which products are frequently purchased together.
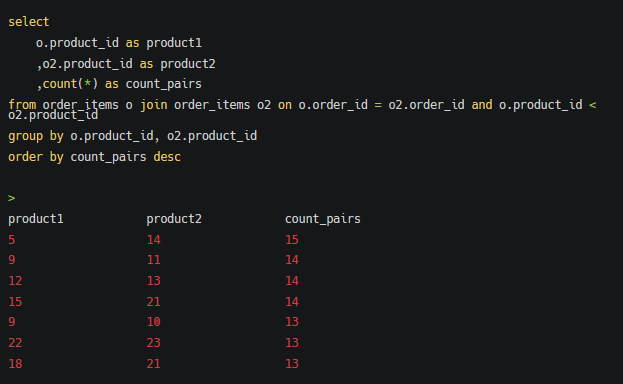
Comment:
Top Pair: Products 5 and 14 were purchased together most often, appearing in 15 orders.
Other Frequent Pairs are 9 & 11, 12 & 13, and 15 & 21, each appearing 14 times, followed by 9 & 10 and 22 & 23 (13 times).
– Adding product category for deeper insights:
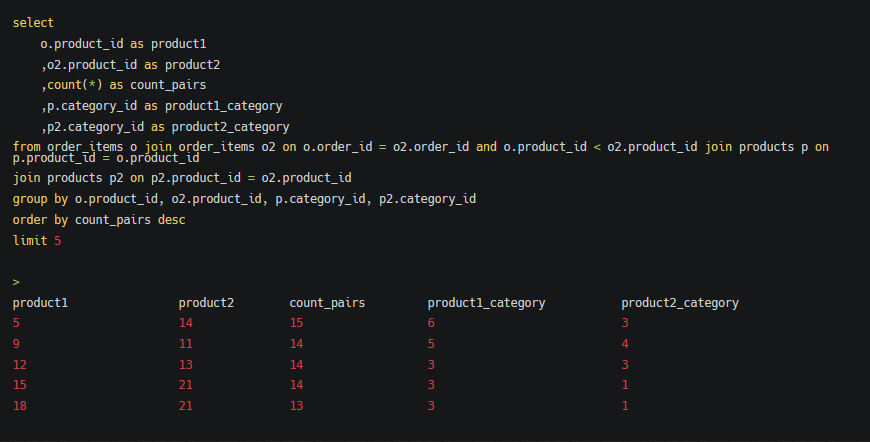
Category 3 appears in multiple pairs (12 & 13, 15 & 21, and 18 & 21), indicating it contain frequently purchased products. We confirmed it on the beggining of the analysis – category 3 (Cruisers Bicycles) are top-sellers.
5. Results Analysis
The analysis revealed key insights across products, customers, sales, and inventory management:
Products
- The store offers 321 products across 9 brands and 7 categories.
- The most expensive categories are Electric Bikes and Road Bikes, with average prices of $3,281.66 and $3,175.36, respectively. The cheapest category is Children’s Bicycles at $287.79.
- The largest selection of models is in Cruisers Bicycles, followed by Mountain Bikes, while Cyclocross Bicycles has the least variety with only 10 models.
- Trek leads in product offerings with 135 models, followed by Electra with 118, while brands like Ritchey offer only a single product.
Customers and Sales
- The store served 1,445 unique customers over 1,615 orders between January 2016 and December 2018.
- The most profitable product was Trek Slash 8 27.5 – 2016, generating $615,998.46, despite being the 26th most expensive model.
- A total of 14 products have never been ordered, indicating potential inventory gaps or lack of demand.
- The most popular product categories are Cruisers Bicycles and Mountain Bikes, with over 150 units of specific models like Surly Ice Cream Truck Frameset – 2016 being sold.
- The top-performing store is Baldwin Bikes, contributing $5,826,242.21 in revenue, far ahead of Santa Cruz Bikes and Rowlett Bikes.
Customer Behavior
- Only 9% of customers (131) returned for multiple purchases, indicating a low retention rate.
- The top 1% of customers collectively spent the most, with the highest spenders originating from New York, Texas, and California.
Inventory Insights
- Stores #1 and #2 each have 10 products out of stock, while Store #3 has 5 missing products.
Store 2 shows the largest issue with overstocked products, and has the most understocked products, highlighting potential issues with inventory management or demand forecasting