Coffee Shop – Sales Analysis
Marta Kowalczyk
1. Introduction
In this project, I will conduct a comprehensive analysis of sales data from a coffee shop to uncover key trends and insights that can guide business decisions. Understanding the dynamics of product sales, customer preferences, and overall store performance is crucial for optimizing operations, inventory management, and marketing strategies.
The dataset includes information about individual transactions, such as product details, unit prices, quantities sold, total sales, and store location. By leveraging this data, I will explore the most popular products, identify sales patterns across different time periods (days, months, hours), and assess the impact of pricing on sales volume.
The objectives of this analysis are to:
- Identify top-performing products and categories.
- Analyze sales trends by time of day, day of the week, and month.
- Examine average transaction size and customer spending habits.
- Provide actionable recommendations for improving sales performance and profitability.
The outcome of this analysis will offer valuable insights to optimize the coffee shop’s operations and help develop more targeted marketing strategies to drive growth.
The data analysis will be performed in SQL Server, while data visualization will be carried out in Power BI for clear and insightful presentation.
2. Data Description
The dataset was found on Kaggle (https://www.kaggle.com/datasets/divu2001/coffee-shop-sales-analysis). It contains 18 columns and 149117 rows.
- transaction_id: A unique identifier for each individual sale transaction.
- transaction_date: The date on which the transaction occurred.
- transaction_time: The specific time at which the transaction was recorded.
- store_id: An identifier for the store where the transaction took place.
- store_location: The physical location of the store (e.g., city or area).
- product_id: A unique identifier for each product sold in the transaction.
- transaction_qty: The quantity of the product sold in the transaction.
- unit_price: The price of a single unit of the product.
- Total_Bill: The total amount paid for the transaction (calculated as quantity multiplied by unit price).
- product_category: The general category under which the product falls (e.g., beverages, snacks).
- product_type: The specific type of product within the category (e.g., coffee, tea, pastry).
- product_detail: Detailed description of the product (e.g., latte, cappuccino).
- Size: The size of the product (e.g., small, medium, large).
- Month Name: The name of the month when the transaction occurred.
- Day Name: The name of the day of the week when the transaction occurred.
- Hour: The hour of the day when the transaction was made.
- Month: The numeric representation of the month (e.g., 1 for January).
- Day of Week: The numeric representation of the day of the week (e.g., 1 for Monday).
3. Data Exploration
Summary:
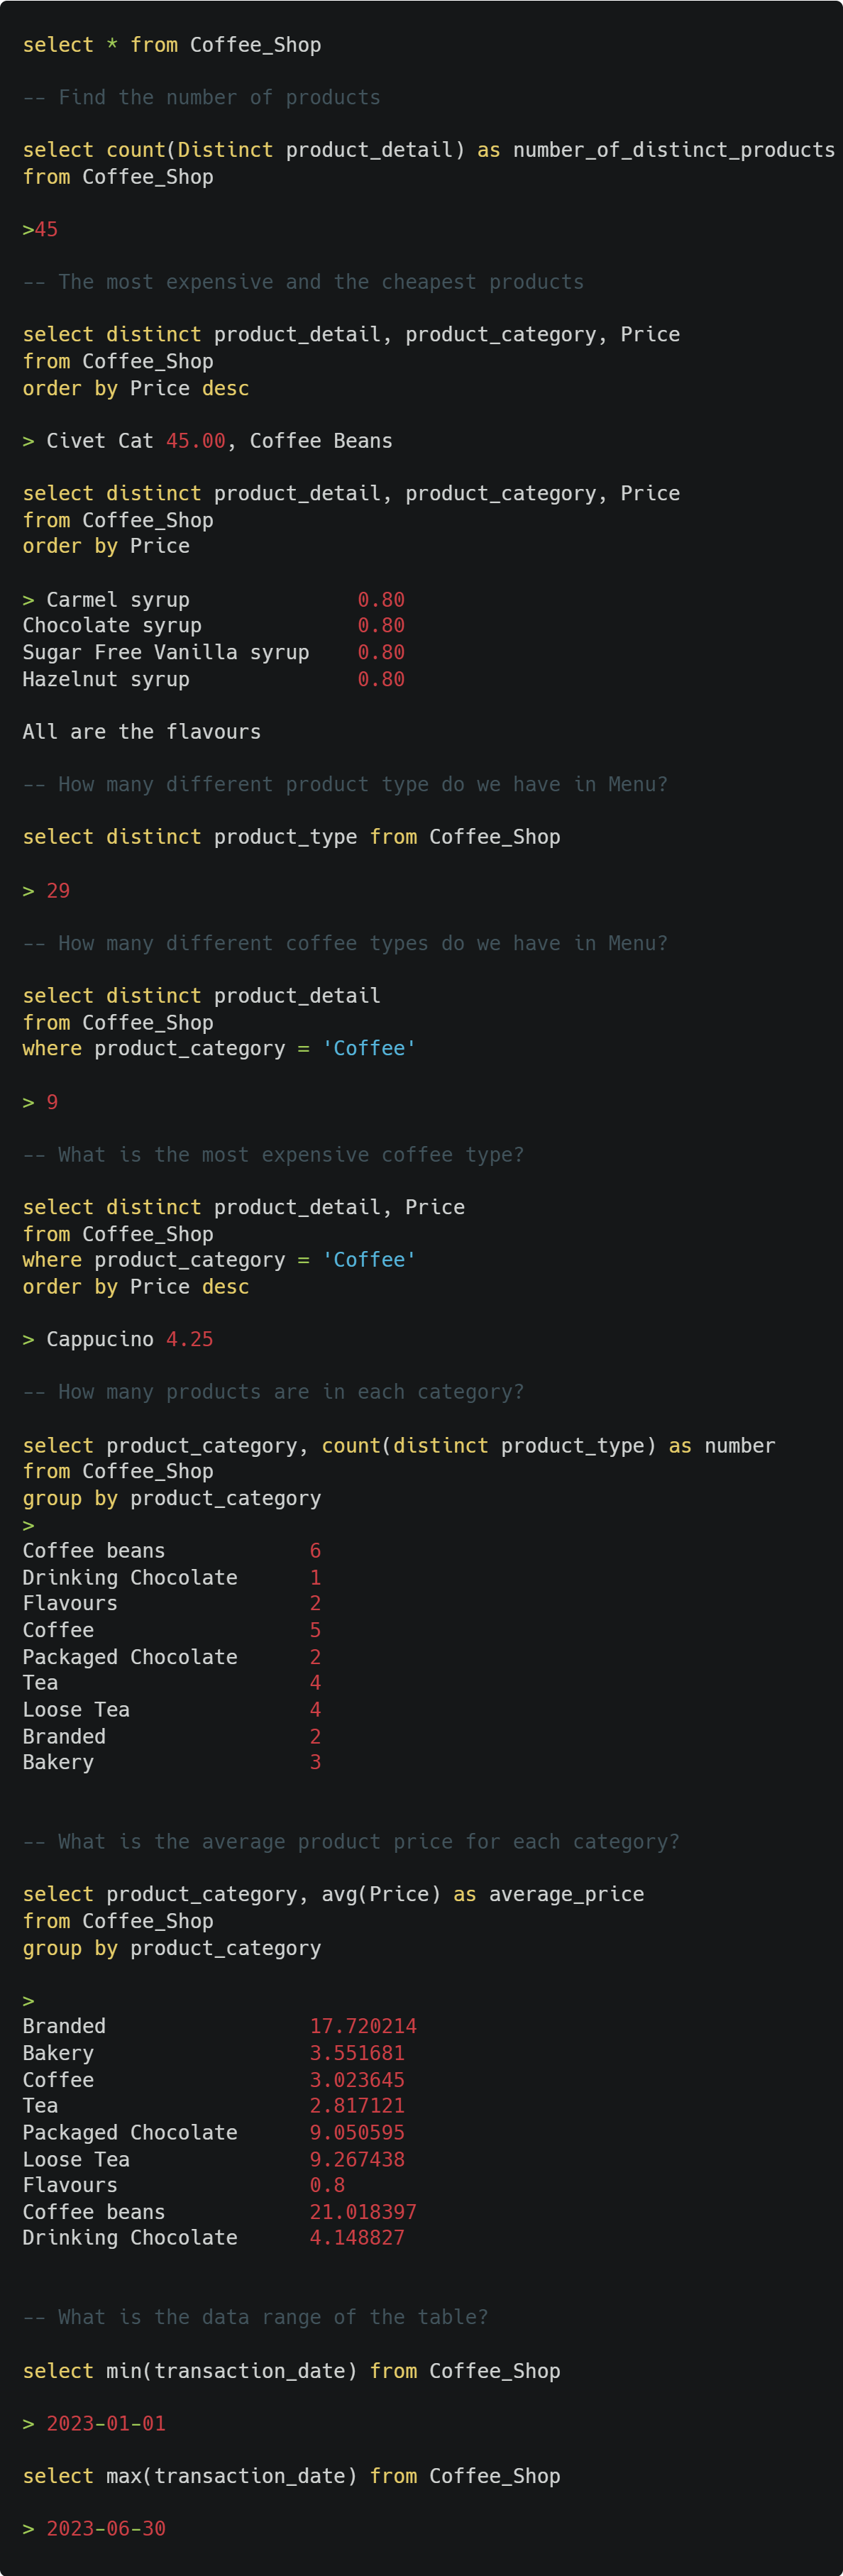
The Coffee Shop offers a diverse menu with 45 distinct products, spanning across categories like coffee, tea, bakery items, and more. There are 29 different product types available on the menu.
The most expensive product is Civet Cat Coffee Beans priced at $45.00. On the lower end, various flavored syrups like Caramel, Chocolate, Sugar-Free Vanilla, and Hazelnut are the cheapest products, each priced at just $0.80
The shop offers 9 distinct coffee types, with Cappuccino being the most expensive at $4.25.
Branded items and Coffee Beans have the highest average prices at $17.72 and $21.02 respectively. Flavours are the cheapest category, with an average price of just $0.80, which aligns with the nature of these small add-on items.
The dataset captures transactions over a six-month period, from January 1, 2023, to June 30, 2023.
4. Analysis of Customer Behaviour
What were the most and least ordered products?
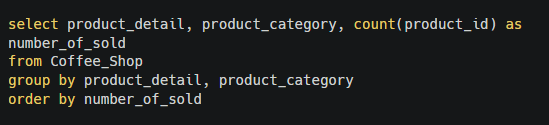
Comment:
The least ordered products are primarily coffee beans and loose teas, indicating that our customers tend to prefer enjoying their coffee or tea on-site rather than purchasing these items for home use.
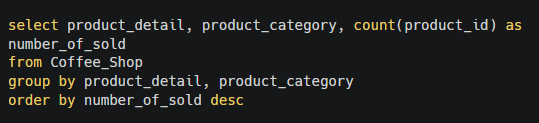
Comment:
The most ordered products are coffees.
What were TOP 5 Products that generated the most revenue?
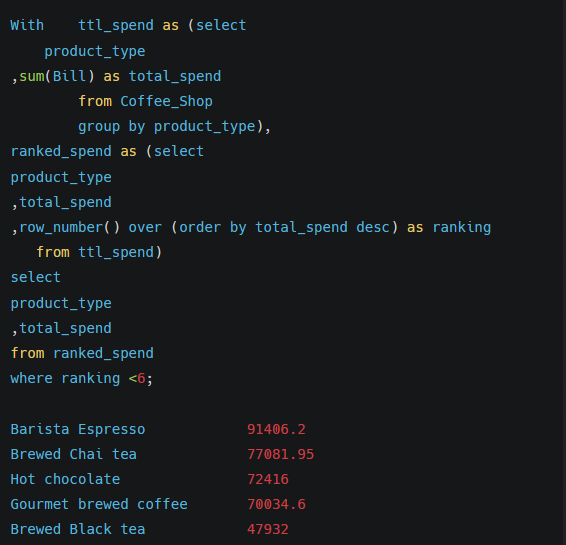
Comment:
Barista Espresso leads as the most popular product, generating the highest total revenue of 91,406.20. Brewed Chai Tea ranks second with 77,081.95, showcasing its popularity as a specialty tea option. Hot Chocolate takes the third spot with 72,416.00 and Gourmet Brewed Coffee follows closely at 70,034.60, reflecting its appeal to coffee enthusiasts seeking premium options.
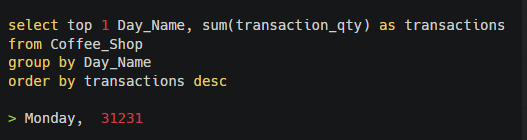
On which day of the week were the most transactions recorded?
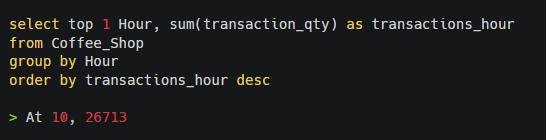
At what time do most purchases occur?
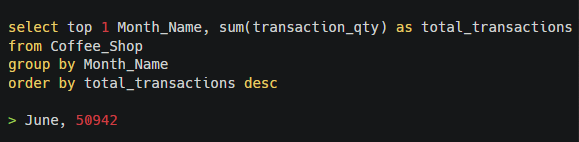
In which month were the highest number of transactions recorded?
Comment:
The highest number of transactions occurred on Monday, with a total of 31,231 transactions, indicating that the start of the week is a peak time for customer activity.
The busiest hour for purchases is 10 AM, with 26,713 transactions recorded, suggesting this is a popular time for customers, likely for morning coffee or snacks. June saw the highest number of transactions, totaling 50,942, possibly reflecting seasonal trends or promotional events driving increased sales during this period.
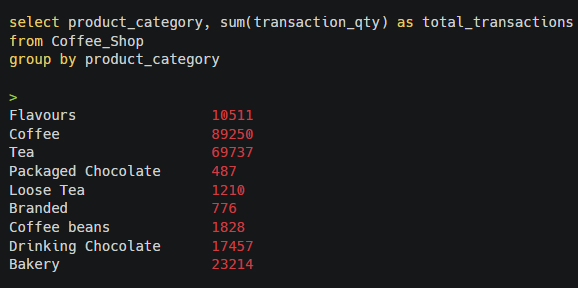
What is the number of transactions for each product category?
Comment:
Coffee leads with the highest number of transactions, reaching 89,250, reflecting its dominant role in sales. Tea follows with 69,737 transactions. Categories like Coffee beans and Loose Tea show relatively lower activity, with 1,828 and 1,210 transactions.
How do revenues change depending on the time of day?
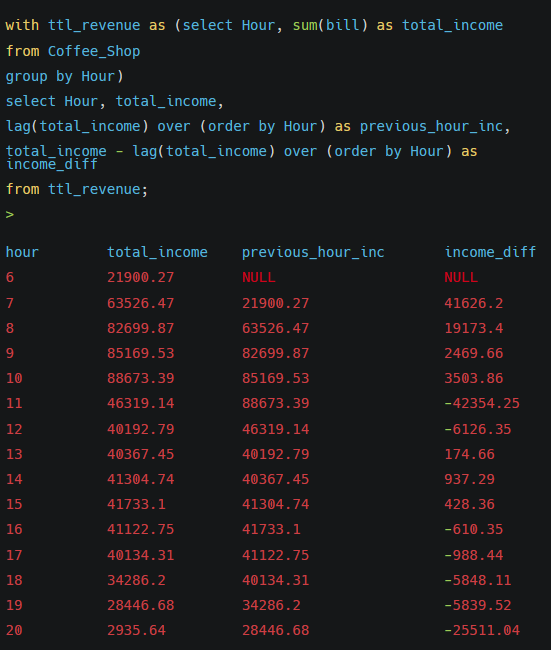
Comment:
The peak revenue hours are between 9 AM and 10 AM, with total incomes of 85,169.53 and 88,673.39, making this the most profitable period of the day. Early mornings (6 AM to 8 AM) also generate substantial revenue. As the day progresses, there is a steady decline in income starting from 11 AM.
How often are products of a specific size sold?
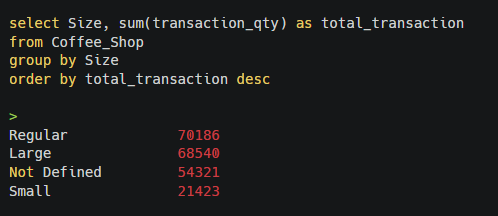
Comment:
Regular size products are the most popular, with a total of 70,186 transactions. There is a strong demand for larger options as well. Small size products are the least sold, with 21,423 transactions, suggesting a lower preference for smaller portions.
5. Store Profitability Analysis
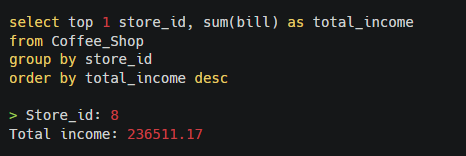
Which store generates the highest revenue?
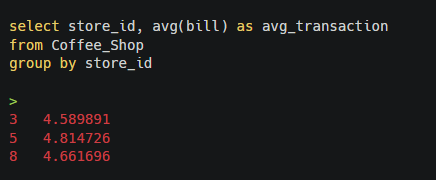
What are the average transaction values for each store?
Comment:
Store 8 generates the highest revenue, with a total income of $236,511.17, making it the top-performing location in terms of sales.
When looking at average transaction values across stores:
Store 5 has the highest average transaction value at $4.81, indicating slightly higher spending per purchase compared to other locations.
Store 8, despite having the highest total income, has a lower average transaction value of $4.66, suggesting higher volume but potentially lower per-transaction spend.
Store 3 has the lowest average transaction value at $4.59.
Which products are purchased most frequently at a specific store?
Comment:
Store 8 generates the highest revenue, with a total income of $236,511.17, making it the top-performing location in terms of sales.
When looking at average transaction values across stores:
Store 5 has the highest average transaction value at $4.81, indicating slightly higher spending per purchase compared to other locations.
Store 8, despite having the highest total income, has a lower average transaction value of $4.66, suggesting higher volume but potentially lower per-transaction spend.
Store 3 has the lowest average transaction value at $4.59.
What is the average number of products purchased per transaction in each store?
Comment:
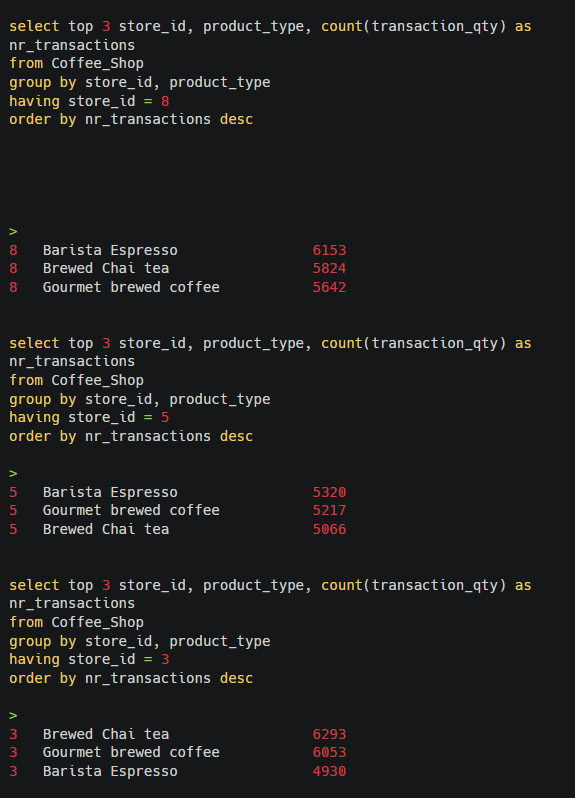
At Store 8, the most frequently purchased product is Barista Espresso with 6,153 transactions, followed by Brewed Chai tea and Gourmet brewed coffee, highlighting customer preference for espresso-based beverages.
Similarly, at Store 5, Barista Espresso leads in popularity with 5,320 transactions, closely followed by Gourmet brewed coffee and Brewed Chai tea, indicating a similar product preference trend.
In Store 3, Brewed Chai tea is the top choice with 6,293 transactions, followed by Gourmet brewed coffee and Barista Espresso.
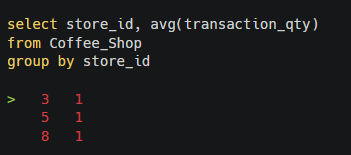
Additionally, all three stores have an average of 1 product purchased per transaction, suggesting a consistent buying pattern where customers typically purchase a single item at a time.
Which store has the highest average bill per transaction, but only for weekdays?
Comment:
At Store 8, the most frequently purchased product is Barista Espresso with 6,153 transactions, followed by Brewed Chai tea and Gourmet brewed coffee, highlighting customer preference for espresso-based beverages.
Similarly, at Store 5, Barista Espresso leads in popularity with 5,320 transactions, closely followed by Gourmet brewed coffee and Brewed Chai tea, indicating a similar product preference trend.
In Store 3, Brewed Chai tea is the top choice with 6,293 transactions, followed by Gourmet brewed coffee and Barista Espresso.
Additionally, all three stores have an average of 1 product purchased per transaction, suggesting a consistent buying pattern where customers typically purchase a single item at a time.
What are the total and average transaction values for each store by month?
Which days of the week are the most profitable depending on the store?
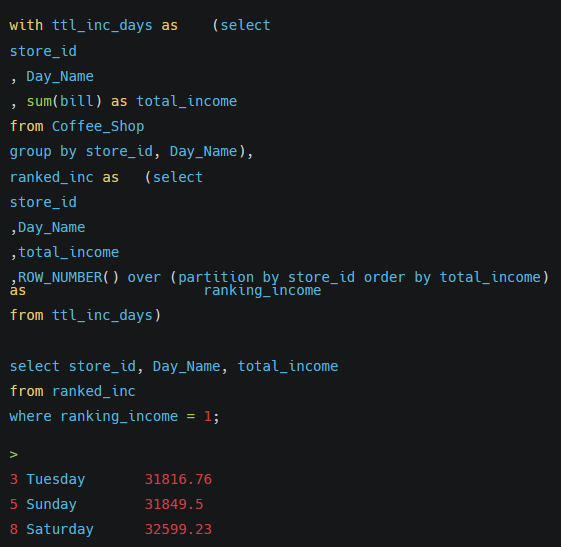
Comment:
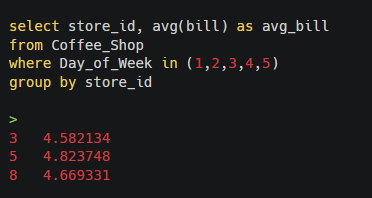
Store 5 has the highest average bill per transaction on weekdays, with an average of $4.82, slightly higher than Store 8 and Store 3.
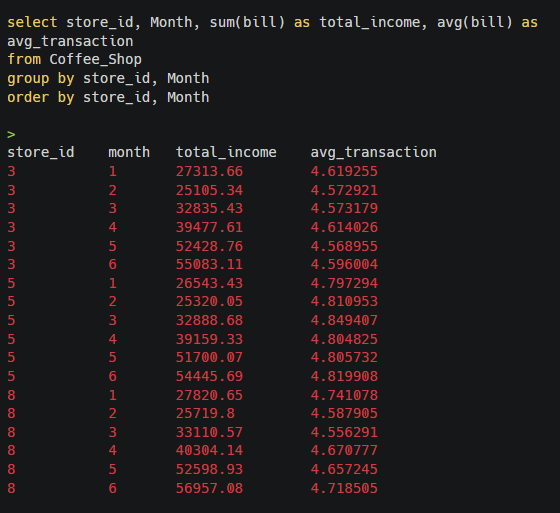
Monthly revenue patterns show that Store 8 consistently generates the highest total income, peaking in June with $56,957.08, while the average transaction value across months hovers around $4.66 to $4.74.
The most profitable day of the week varies by store: Tuesday is the most profitable for Store 8 with $34,846.47, while Monday brings the highest income for Store 5 ($34,359.48), and Wednesday leads for Store 3 with $34,244.63.
6. Results Analysis
1 – Identify top-performing products and categories.
* Across all stores, Barista Espresso and Brewed Chai Tea consistently rank as the most frequently purchased products.
* The Coffee category generates the highest number of transactions (89,250), indicating strong customer preference for coffee-related products.
* Across all stores, Barista Espresso and Brewed Chai Tea consistently rank as the most frequently purchased products.
* The Coffee category generates the highest number of transactions (89,250), indicating strong customer preference for coffee-related products.
2 – Analyze sales trends by time of day, day of the week, and month.
* Sales peak around 10 AM, with total income reaching $88,673.39 at this hour, making it the most profitable time of day. Morning hours, especially between 7 AM and 10 AM, show the strongest sales.
* Monday records the highest number of transactions (31,231), while June is the busiest month with 50,942 transactions, reflecting seasonal trends in consumer behavior.
3 – Examine average transaction size and customer spending habits.
Store 5 has the highest average transaction value, particularly on weekdays, with an average bill of $4.82 per transaction, slightly ahead of other stores. This suggests a higher customer spending habit during the week in this store.
* Across all stores, customers tend to purchase around one product per transaction
4 – Provide actionable recommendations for improving sales performance and profitability.
* Target morning hours (especially 7-10 AM) with promotions or discounts, as this is the peak sales period across all stores.
* Focus on increasing transaction size, as customers typically buy only one product. Bundle offers or loyalty programs could encourage larger purchases.
* Leverage high-demand products like Barista Espresso and Brewed Chai Tea by creating special offers or upsell opportunities in these categories.
* Focus on improving store performance on busy days like Monday and Tuesday by using targeted marketing strategies to increase sales even more on these days.