HR – Salary Analysis
Marta Kowalczyk
1. Introduction
In this project, I will be analyzing salary data from an HR dataset to gain insights into how compensation varies across different dimensions within the company. The analysis will focus on key factors such as departments, countries, and gender to identify trends and potential disparities in employee pay.
By conducting exploratory data analysis (EDA) and developing an interactive dashboard, this project aims to provide a comprehensive overview of the salary distribution, helping stakeholders make informed decisions regarding compensation policies and equality in the workplace.
Research questions:
- What is the overall distribution of salaries across the company?
- How do salaries differ across departments?
- Is there a gender pay gap within the company?
- How do salaries vary by country or location?
- Does the length of employment affect salary?
The exploratory data analysis (EDA) and statistical tests will be performed using Python, while data visualization will be carried out in Power BI for clear and insightful presentation.
2. Data Description
This dataset contains detailed information on employees across various departments and countries, capturing key aspects of their employment and performance metrics. It was found on Kaggle page (https://www.kaggle.com/datasets/abdallahwagih/company-employees).
The dataset utilised for this analysis contains 689 rows and 15 columns. Each row corresponds to an individual data entry, while the columns represent different attributes or variables captured in the dataset.
- No: Unique identifier for each employee.
- First Name: The employee’s first name.
- Last Name: The employee’s last name.
- Gender: Gender of the employee (Male/Female).
- Start Date: The date when the employee started working in the company.
- Years: The number of years the employee has been with the company.
- Department: The department in which the employee works.
- Country: The country where the employee is located.
- Center: The center (region or office) where the employee is based.
- Monthly Salary: The employee’s monthly salary in USD.
- Annual Salary: The employee’s annual salary in USD.
- Job Rate: A performance rating or job rate on a scale (details to be specified if available).
- Sick Leaves: The number of sick leaves taken by the employee.
- Unpaid Leaves: The number of unpaid leaves taken by the employee.
- Overtime Hours: The total number of overtime hours worked by the employee.
- HeadInjury: History of head injury, where 0 indicates No and 1 indicates Yes. Categorical variable.
- Hypertension: Presence of hypertension, where 0 indicates No and 1 indicates Yes. Categorical variable.
3. Data Preprocessing
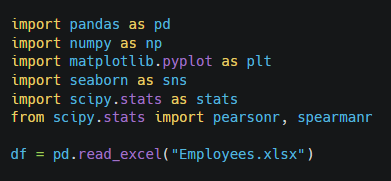
Import of Libraries and Dataset
Preliminary Data Exploration
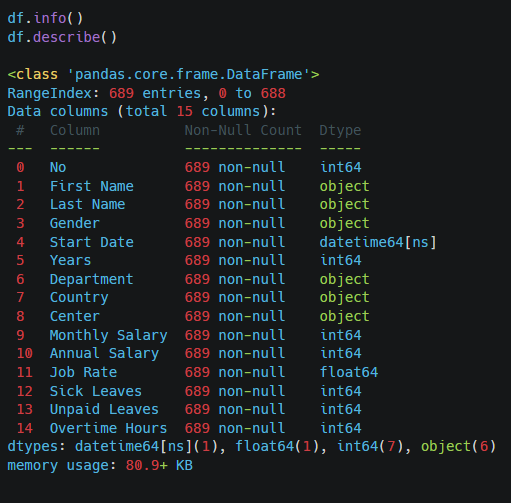
| No | Start Date | Years | Monthly Salary | Annual Salary | Job Rate | Sick Leaves | Unpaid Leaves | Overtime Hours | |
|---|---|---|---|---|---|---|---|---|---|
| count | 689 | 689 | 689 | 689 | 689 | 689 | 689 | 689 | 689 |
| mean | 345 | 20:07.0 | 1.476052 | 2068.201742 | 24818.4209 | 3.586357 | 1.609579 | 0.759071 | 13.702467 |
| min | 1 | 08/01/2016 00:00 | 0 | 703 | 8436 | 1 | 0 | 0 | 0 |
| 25% | 173 | 05/04/2018 00:00 | 1 | 1436 | 17232 | 3 | 0 | 0 | 3 |
| 50% | 345 | 03/04/2019 00:00 | 1 | 2077 | 24924 | 3 | 0 | 0 | 7 |
| 75% | 517 | 22/12/2019 00:00 | 2 | 2682 | 32184 | 5 | 3 | 0 | 10 |
| max | 689 | 29/12/2020 00:00 | 5 | 3450 | 41400 | 5 | 6 | 6 | 198 |
| std | 199.041453 | NaN | 1.190963 | 763.28924 | 9159.470878 | 1.350125 | 2.196051 | 1.647764 | 25.692049 |
Comment:
This table summarizes key descriptive statistics for a dataset. Key insights:
· The salary distribution is skewed towards the higher end, with the top 25% earning much more than the bottom 25%.
· Sick and unpaid leaves are relatively uncommon, with a majority of employees not using them.
· While the average overtime hours seem modest, there are outliers with extremely high overtime, which could be an area worth investigating for workload management or compensation.
Checking Duplicated Rows

Comment: There are no duplicated values.
Checking Missing Values
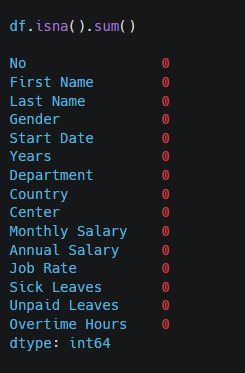
Comment: There are no missing values.
Getting rid of Column «No»

Comment: Column «No» with indexing dropped.
Changing format «Start Date» column

4. Exploratory Data Analysis – EDA
4.1 What is the overall distribution of salaries across the company?
Annual Salary
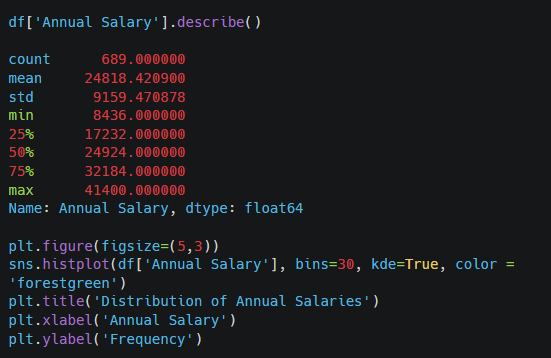
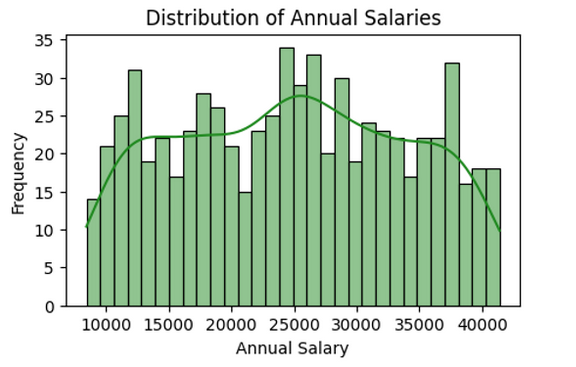
Comment: The average annual salary across the company is approximately 24,818.42. The median salary is slightly higher than the mean, which suggests that the salary distribution might be somewhat skewed to the right (i.e., there are higher salaries that are raising the average).
– What is the overall distribution of salaries across the company?
The data shows a spread of salaries from 8,436 to 41,400, with a significant portion of employees earning less than the mean. The mean is influenced by the high-end salaries, as indicated by the difference between the mean and median.
With a standard deviation of 9,159.47, there is considerable variability in salaries, which suggests that some employees earn significantly more or less than the average.
The presence of low minimum salaries and a considerable standard deviation may indicate wage inequality within the company or variations in job roles and experience levels.
4.2 How do salaries differ across departments?
Departments

Comment:
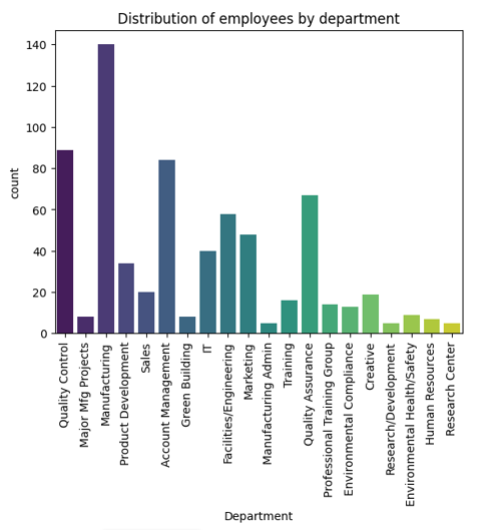
The bar chart displays the distribution of employees across various departments. Key observations include:
– Major Manufacturing Projects has the highest number of employees, with over 140 individuals.
– Quality Control and Sales also employ a large number of workers, with around 80 and 70 employees, respectively.
– On the lower end, departments like Human Resources, Environmental Health/Safety, and Research Center have the smallest employee counts, with fewer than 10 employees each. – Training, Quality Assurance, and Product
Development have moderate employee counts, showing that the company has a diverse distribution of workers across functions.
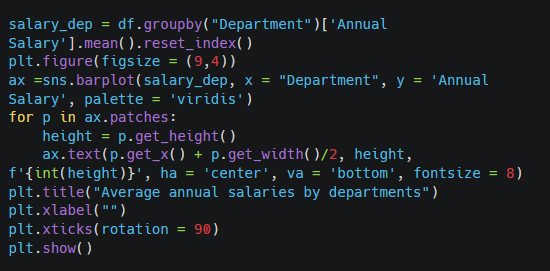
Average Salaries by Department
Comment:
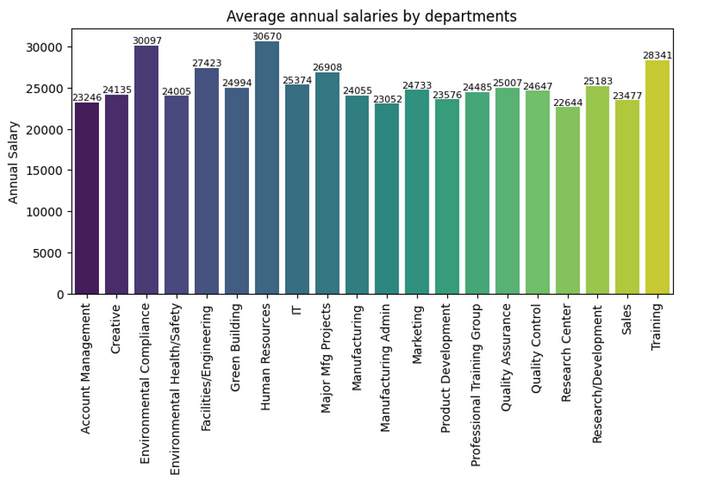
The bar chart reveals that employees in the HR department receive the highest average annual salaries, amounting to 30,670. Similarly, the Training and Environmental Compliance departments also offer competitive salaries, averaging 28,341 and 30,097, respectively. In contrast, the departments with the lowest average annual salaries are Manufacturing Admin (23,052), Research Center (22,644), and Account Management (23,246).
– How do salaries differ across departments?
One of the first things we can notice is that the Manufacturing department, which employs the largest number of people, offers one of the lowest average salaries at 24,055.
In contrast, the HR department, which has fewer than 10 employees, provides the highest average salaries at 30,670. This contrast could suggest that larger departments do not necessarily correlate with higher compensation, while smaller, specialized departments may offer more competitive salaries, but it’s not true as Research Center contracts only few people and offer them the lowest salaries. Generally, HR, Training and Environmental Compliance departments offer the most competitive salaries. In contrast, Manufacturing Admin (23,052), Research Center (22,644), and Account Management (23,246) are in the bottom 3.
4.3 Is there a gender pay gap within the company?
Gender

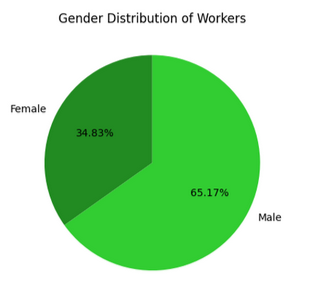
Comment: There are nearly twice as many men as women working at the company.
Gender vs Annual Salary

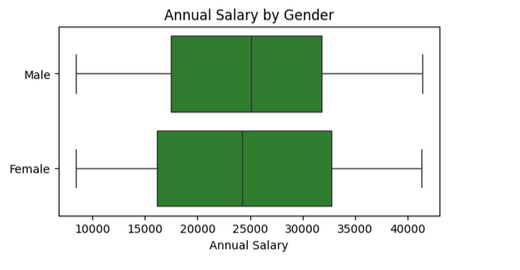

Comment: The data shows that the average annual salary for female employees is 24,708.9, while for male employees it is slightly higher at 24,876.96. This small difference of about 168.06 suggests that there is no substantial gender pay gap within the company, as both male and female employees receive very similar average salaries.
Check for Normal Distribution

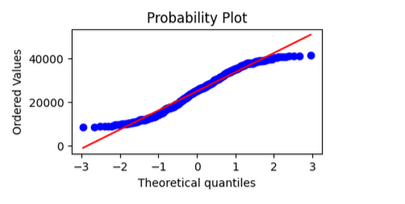

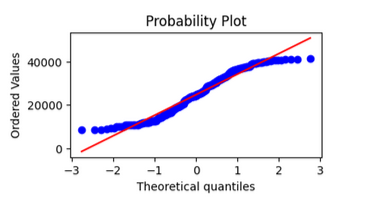
Comment: The distribution isn’t normal – we can’t use T-test to check if there is a significant difference between salaries of both genders.
Mann-Whitney U Test
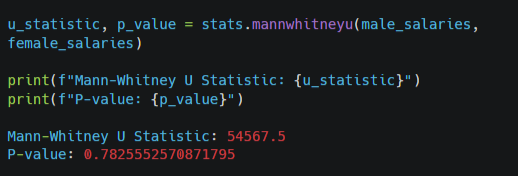
Null Hypothesis: There is no significant difference between the distributions of the two groups being compared.
Comment:
The U statistic of 54567.5 is a measure of the rank sums between the two groups (males and females). The p-value of approximately 0.7826 is quite high, which is significantly greater than the common alpha level of 0.05. This indicates that there is no statistically significant difference in annual salaries between male and female employees in the dataset.
– Is there a gender pay gap within the company?
Based on the analysis conducted using the Mann-Whitney U test, there is no statistically significant difference in annual salaries between male and female employees within the company. This suggests that gender does not play a meaningful role in salary disparities in this dataset.
4.4 How do salaries vary by country or location?
Country
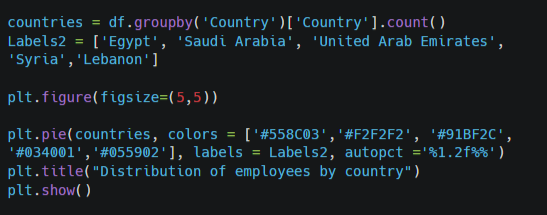
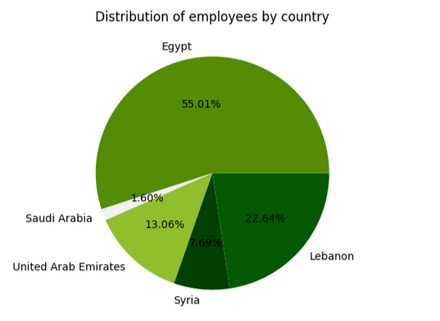
Comment: Egypt employs the largest share of the workforce, accounting for approximately 55% of the total employees. Lebanon follows with almost 23%, and the United Arab Emirates contributes 13%. The centers located in Saudi Arabia and Syria are the smallest, together making up only 10% of the total workforce.
Center
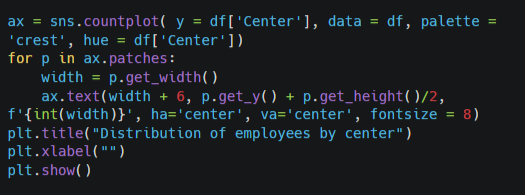
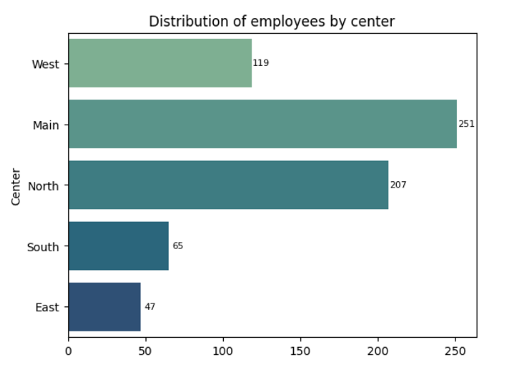
Comment: The Main Center employs the largest share of the workforce with 251 employees. The North Center follows with 207 employees, and the West Center has 119 employees. The South and East Centers are the smallest, with only 65 and 47 employees, respectively.
Average Annual Salaries by Country
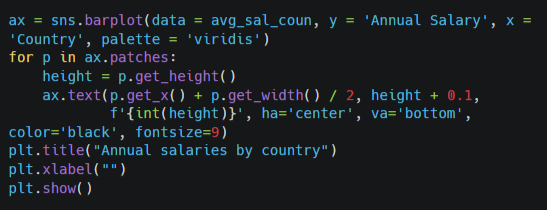
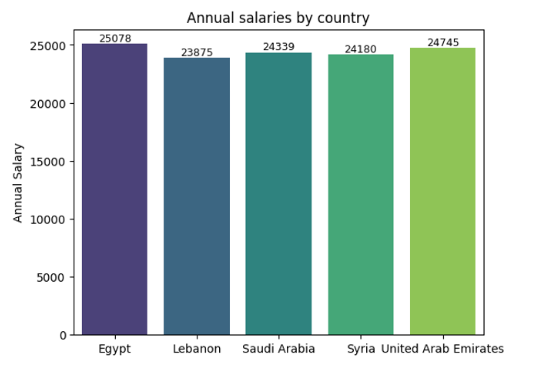
Comment: The highest average annual salary is found in Egypt, averaging 25,078, followed closely by the United Arab Emirates with 24,745. Saudi Arabia and Syria have similar salary ranges, at 24,339 and 24,180, respectively. Lebanon offers the lowest average salary, with employees earning 23,875 annually.
Average Annual Salaries by Center
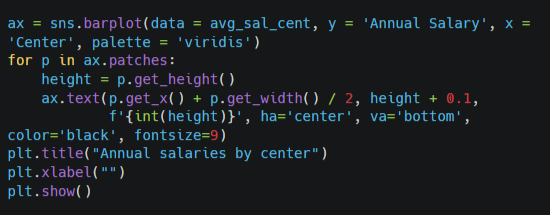
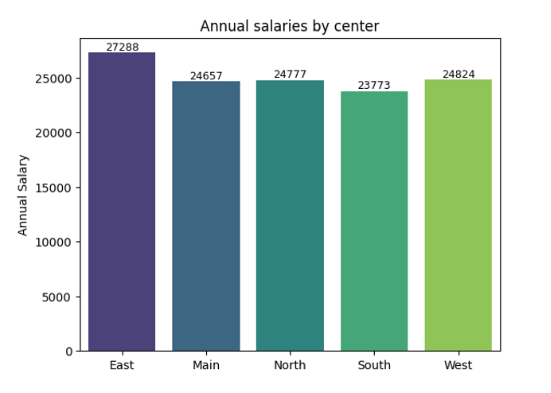
Comment: The highest average annual salary is found in the East Center, with an average of 27,288. The Main, North, and West Centers show similar salary ranges, averaging between 24,657 and 24,824. The South Center offers the lowest average salary, with employees earning 23,773 annually.
– How do salaries vary by Country or Location?
In conclusion, there are clear salary differences across countries and centers within the company, but these variations do not directly align with the size of the workforce in each location. Egypt and the East Center offer the highest average salaries, despite having a smaller share of the workforce. Lebanon and the South Center provide the lowest average salaries, even though Lebanon has a relatively larger proportion of employees. The largest centers, such as the Main and North Centers, have moderate salary levels, indicating that workforce size does not necessarily influence pay levels.
These findings suggest that salary distribution is influenced by other factors, such as regional market rates, job roles, or the strategic importance of certain centers, rather than simply the number of employees in each location.
5. Results Analysis
The analysis aimed to explore various factors such as departments, countries, and gender to identify trends and potential disparities in employee pay.
Conclusions:
– The average annual salary across the company is approximately 24,818.42. The mean is influenced by the high-end salaries, as indicated by the difference between the mean and median (24,924).
-HR, Training, and Environmental Compliance departments offer the most competitive salaries. In contrast, Manufacturing Admin, Research Center, and Account Management provide the lowest average salaries. Interestingly, department size does not seem to correlate with compensation, as neither larger nor smaller departments consistently offer higher salaries.
– There is no statistically significant difference in annual salaries between male and female employees within the company. This suggests that gender does not play a meaningful role in salary disparities in this dataset.
– Egypt offers the highest average annual salary at 25,078 and employs the largest portion of the workforce (55%). Lebanon provides the lowest average salary at 23,875, despite employing 23% of the company’s workforce. In terms of centers, the East Center offers the highest average salary (27,288) despite being the smallest with only 47 employees, while the South Center has the lowest salary average (23,773) and also employs fewer people (65 employees). This suggests that while salary differences exist between locations, the number of employees at each center does not necessarily correlate with higher or lower compensation levels.
– Employment duration seems to have no effect on salary within the company.
6. Conclusions
The analysis revealed that the average annual salary in the company is approximately 24,818. The highest salaries are offered in the HR, Training, and Environmental Compliance departments, while the lowest salaries are found in Manufacturing Admin, Research Center, and Account Management. The findings suggest that department size does not directly influence salary levels. Additionally, there is no significant gender pay gap, indicating that salary disparities based on gender are not present in this dataset. In terms of location, Egypt and the East Center offer the highest salaries, while Lebanon and the South Center have the lowest. The number of employees in each location does not appear to correlate with salary levels.
For further research we could check also performance-based compensation. Assess whether performance metrics, such as job evaluations, play a role in salary differences across departments or countries.
7. Additional Information
Power BI Dashboard
To create a dashboard, I had to calculate some basic measures. Examples:
Average gender salaries = AVERAGE(‘Employees clean'[Annual Salary])
Total Number of Employees = COUNTROWS(‘Employees clean’)